
From Prototype to Power BI Project: Bridging the Gap with Claude
You don't have to rebuild your Power BI prototype from scratch in Desktop. You can use it as the starting point for a real report.
Here's how that works, why PBIP is the right output format, and what to watch out for along the way.
What "Converting a Prototype" Actually Means
Before we talk about converting a prototype to Power BI, it helps to look at what we are converting it to.
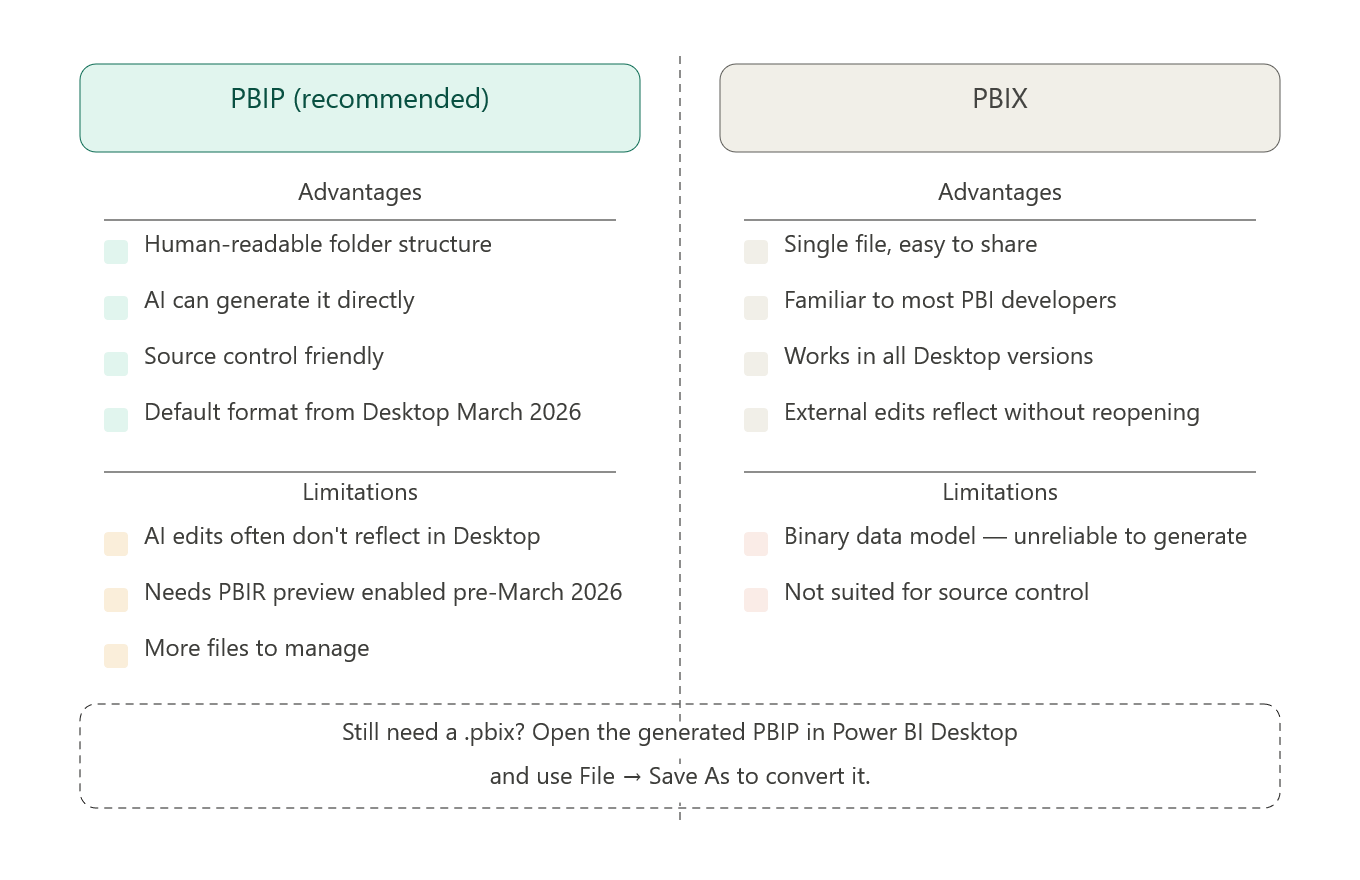
Microsoft introduced a folder-based file format for Power BI reports: PBIP (Power BI Project). Instead of packaging everything into a single binary like PBIX, a PBIP stores the parts of your report (pages, visuals, theme, semantic model, and metadata) as separate, readable files. You still open it the same way: double-click the .pbip file and it opens in Power BI Desktop. Under the hood, the report is written in the newer PBIR style, which stores report contents in a folder-per-visual structure inside the project. This also makes visual specifications a lot more readable.
That readability is the whole reason this workflow exists. A folder of readable files is much easier for AI to generate reliably than a single opaque binary, and easier for you to inspect, version control, and adjust.
So what actually ends up in that PBIP? When you hand the skill a prototype, it translates the page layout and canvas dimensions, visual positions, theme and branding, and the main report elements into a working Power BI project: KPI cards, charts, tables, slicers, and report text such as headers and labels.
It also handles the semantic model in a few different ways. If you just want a starting point, it can generate a placeholder model from the sample data in the prototype. If you already know the target model, it can instead generate a bundled semantic model from your description or point the report to an existing dataset or semantic model once the field mappings are known.
What it does not generate is just as important. Tooltips, drillthrough, bookmarks, row-level security, and page-navigation buttons are intentionally out of scope in the version I build, as are advanced DAX beyond simple placeholder measures, custom or AppSource visuals outside the validated built-in set, and new live data connections that require credentials or gateway setup.
That's a deliberate choice, not a hard limit. The skill works by cloning known-good structures from a seed template (more on that in the next section), and these features don't have a stable structure to clone: they depend on the specific model, page names, and selection states, most of which aren't settled at the prototype stage. They're also quick and safe to add by hand in Desktop, which is exactly where refinement begins.
If you want your own version of the skill to go further, the path is the same one: build the feature once in Desktop, extract its PBIR JSON or other relevant files, and add it to your template as a known-good example. Tooltips, bookmarks, and page navigation are the most reasonable to add this way; I'd leave row-level security and live connections to Desktop.
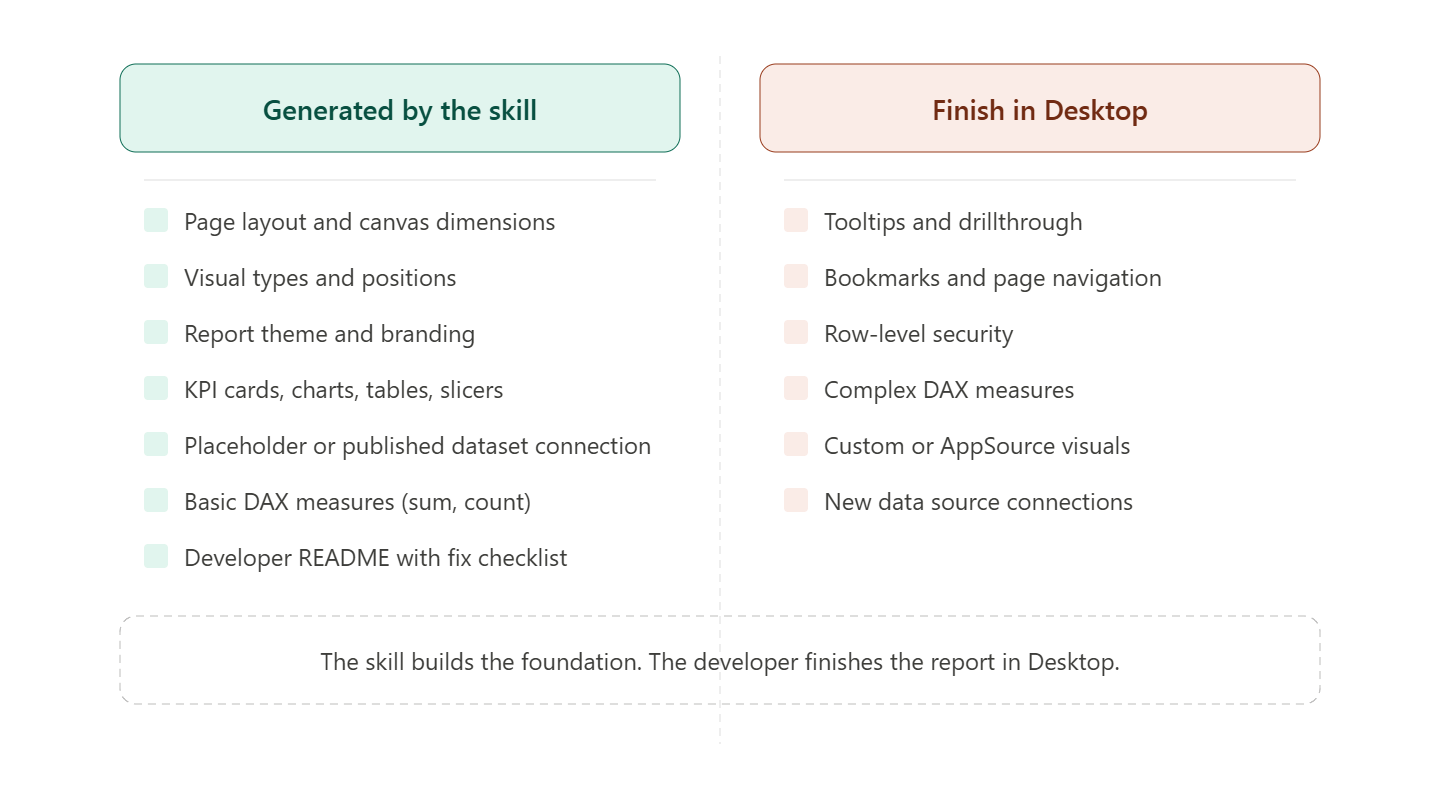
The goal is not to replace Power BI development entirely. It is to give you a real starting point so that the work in Desktop becomes refinement, not reconstruction. The developer who opens the file is not starting from scratch. They are finishing a report, not rebuilding one.
How the Skill Was Built
The goal of this skill is to take a React prototype (especially one generated by the prototype skill from the previous blog, or one that follows the same conventions) and turn it into a PBIP that Power BI Desktop can open.
That turned out to be harder than expected. PBIP files are readable, but they are not forgiving. It was not enough to ask Claude to "generate a Power BI project from this prototype." The first attempts produced JSON that looked plausible, but failed immediately in Desktop because of schema versions, file placement, and the exact JSON shape expected by each visual type.
Here is what I learned while building the skill.
Start with a known-good example
When I first asked AI to generate PBIPs directly, it made a lot of mistakes. The fix was to give the skill a valid seed PBIP created by Power BI Desktop itself.
Instead of inventing the whole structure from scratch, the skill starts from a minimal working example and only changes the parts that need to change: pages, visuals, theme references, logo resources, and semantic model contents. Everything else stays anchored to a structure Desktop already accepts.
Map your visuals before you generate anything
Different Power BI visual types do not just look different; they also expect different JSON structures, data role names, and query definitions. If the skill has to guess those from scratch, it will eventually get them wrong.
That is why it helps to include representative visuals in the minimal working example file. Once those examples exist, the skill can map prototype components to the correct Power BI visual types and reuse known-good structures instead of improvising.
Think about the semantic model
To visualize anything, you need a semantic model. During prototyping, field names were invented for convenience. In the actual report, those fields have to map to something real.
One option is to let the skill generate a placeholder model that mirrors the sample data used in the prototype. But if you already have a real semantic model, that needs to be part of the conversation before generation starts.
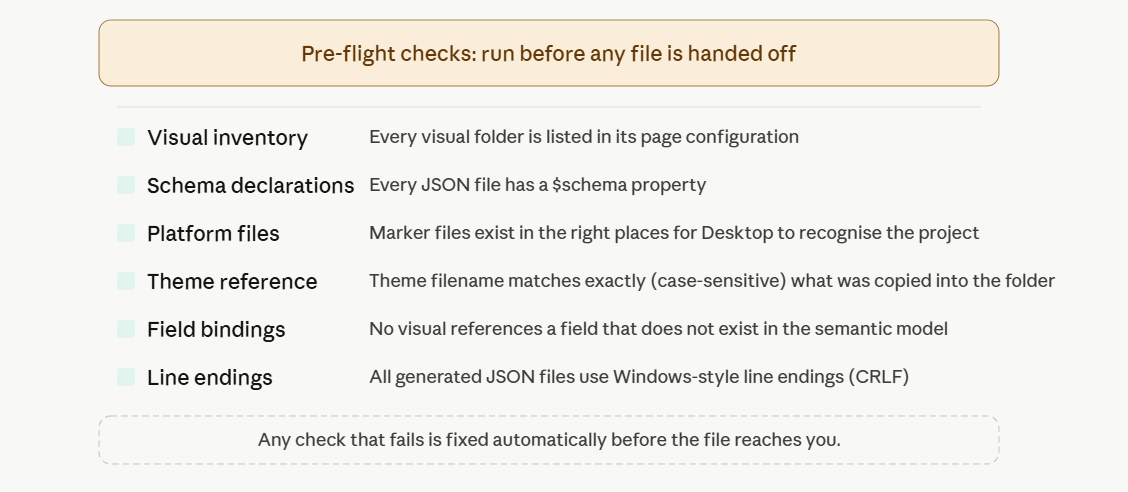
Add a pre-flight validation step
Even with a strong template, AI can still introduce subtle errors: a wrong schema reference, a missing required file, an invalid visual type, or a property in the wrong part of the JSON.
A structured pre-flight validation step helps catch many of these issues before the project ever reaches Power BI Desktop.
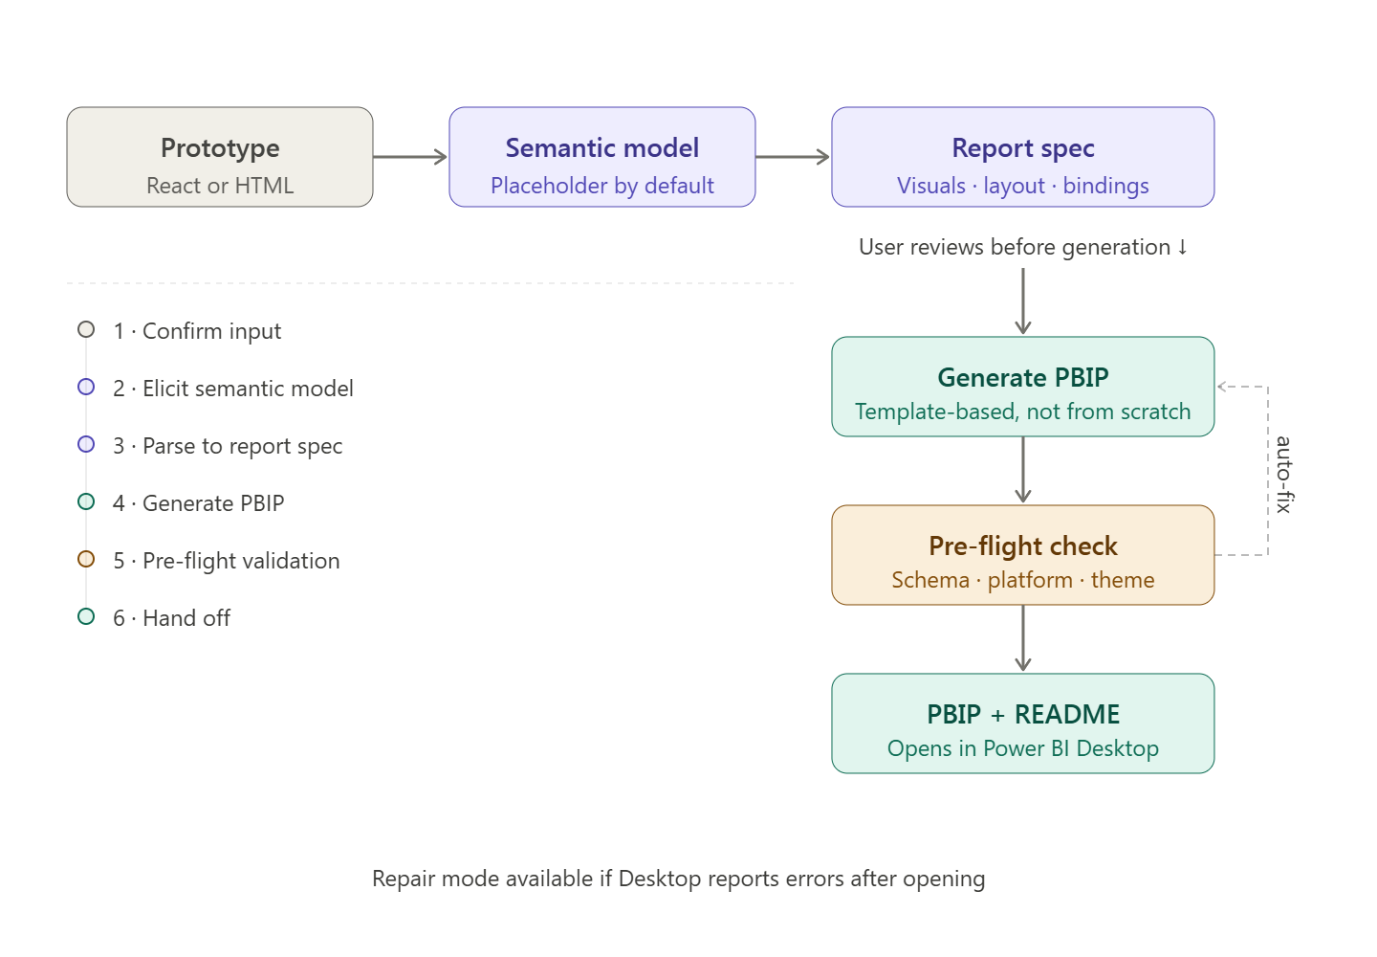
These lessons eventually led to the architecture below.
Now that you know how the skill was built, let's look at the part that needs the most thought before you actually use it.
Choosing the Semantic Model
At some point, the workflow has to move from prototype fields to a real semantic model. That decision needs to be made before generation starts. A prototype can use invented field names like Revenue or OrderDate, but the final report still needs to know what those map to.
In practice, there are four useful options:
- reference an existing published dataset
- reference an existing local PBIP semantic model
- generate a new bundled semantic model from a model description
- generate a placeholder model as a temporary stand-in
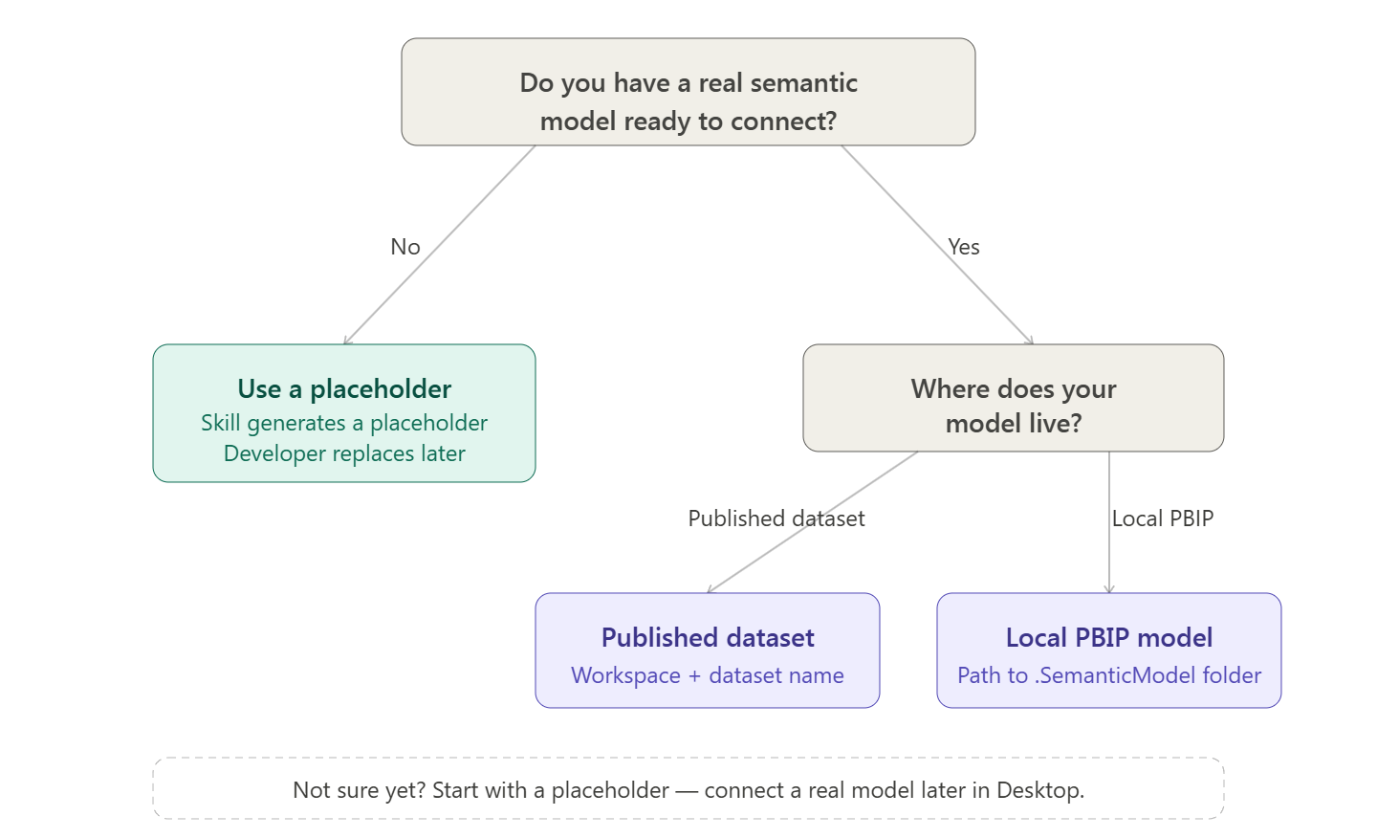
If you want to use an existing model, the skill will still need to understand the structure of this semantic model to correctly map everything. There are several approaches to this.
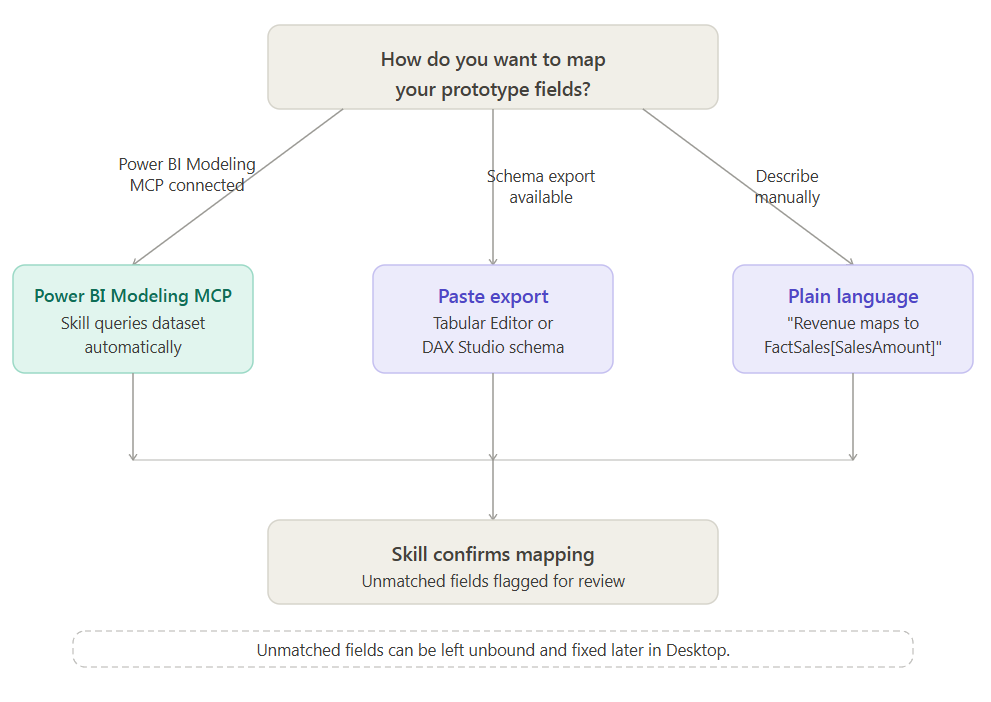
The most convenient option is the Power BI Modeling MCP. Once connected in Claude, it can inspect the available tables, columns, and measures directly from the target dataset, which reduces the amount of manual mapping you need to provide.
If you do not want to use MCP, you can still provide the same information in other ways.
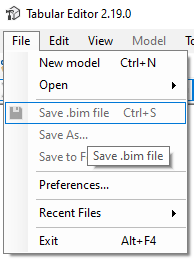
Tabular Editor: the BIM file
Here you simply connect to the semantic model and export it as a BIM file. That gives Claude everything in one structured JSON format that is easy to parse: tables, columns, measures, relationships, and data types.
DAX Studio: Dynamic Management Views (DMV)
If you prefer DAX Studio, that also works, but it is a bit more manual work.
Connect to the semantic model, run the following DMVs, and save or paste the results into Claude so the skill can see which tables, columns, and measures it has available.
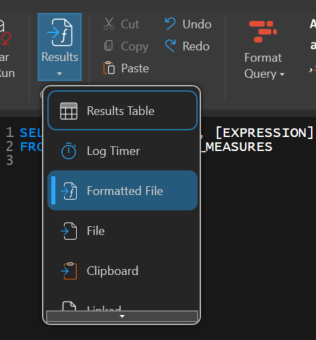
Tables:
SELECT [ID], [Name]
FROM $SYSTEM.TMSCHEMA_TABLES
Columns:
SELECT [TableID], [ExplicitName]
FROM $SYSTEM.TMSCHEMA_COLUMNS
WHERE [TYPE] = 1
Measures:
SELECT [MEASURE_NAME], [EXPRESSION]
FROM $SYSTEM.MDSCHEMA_MEASURES
The Review Checkpoint: the Report Spec
Before any files are generated, the skill produces an intermediate JSON report spec that maps each prototype element to a Power BI visual type, position, and field binding. This is the review checkpoint: your chance to confirm that the right visuals are being created, placed on the right pages, and bound to the right fields before the PBIP is written.
This is where you catch mistakes cheaply, for example a line chart interpreted as a combo chart, a slicer bound to the wrong field, or a layout block positioned incorrectly. Fixing those issues in the spec is much easier than correcting them after a full project has already been generated.
What Gets Generated (and How to Open It)
After sharing the prototype file with the skill, the skill will get to work. For the example below, we started with the prototype created in the Build Power BI Prototypes with AI blog.
You can see the prototype (a React file) here:
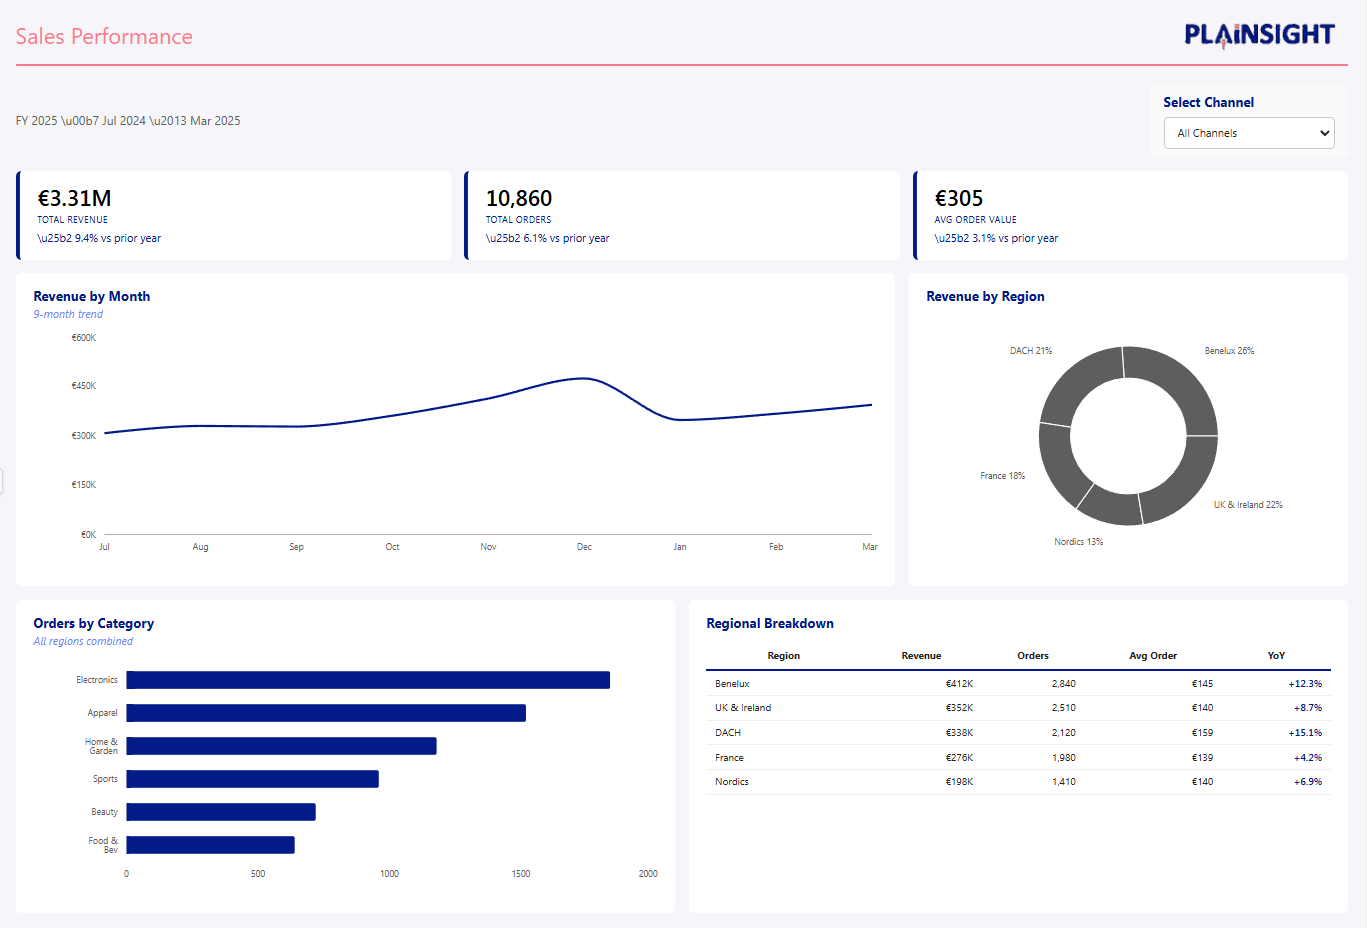
Once the PBIP is generated, you will receive the project folder, in some environments packaged as a ZIP for download. If it comes as a ZIP, extract it first. After that, open the .pbip file directly, or open the report entry point inside the project, in Power BI Desktop.

One important requirement: this workflow targets the newer PBIR-style project structure and should be opened in Power BI Desktop March 2026 or later, or any version with the PBIR preview enabled under File > Options > Preview features. If you try to open it in an older version, failures may have nothing to do with the generated content at all.
AI gets you going but isn't perfect. You're the human in the loop.
You may still run into edge cases. If Power BI Desktop shows an error when opening the project, copy that exact message back into Claude. Those errors are often specific enough to point to a schema mismatch, a missing file, or a visual definition that needs adjusting, and each one is useful feedback for improving the skill so the same issue gets caught earlier next time.
You may also open the report and initially see no data, especially when the semantic model reference is valid but the report has not refreshed yet. In that case, a refresh may be enough to resolve the connection state and render the visuals correctly.
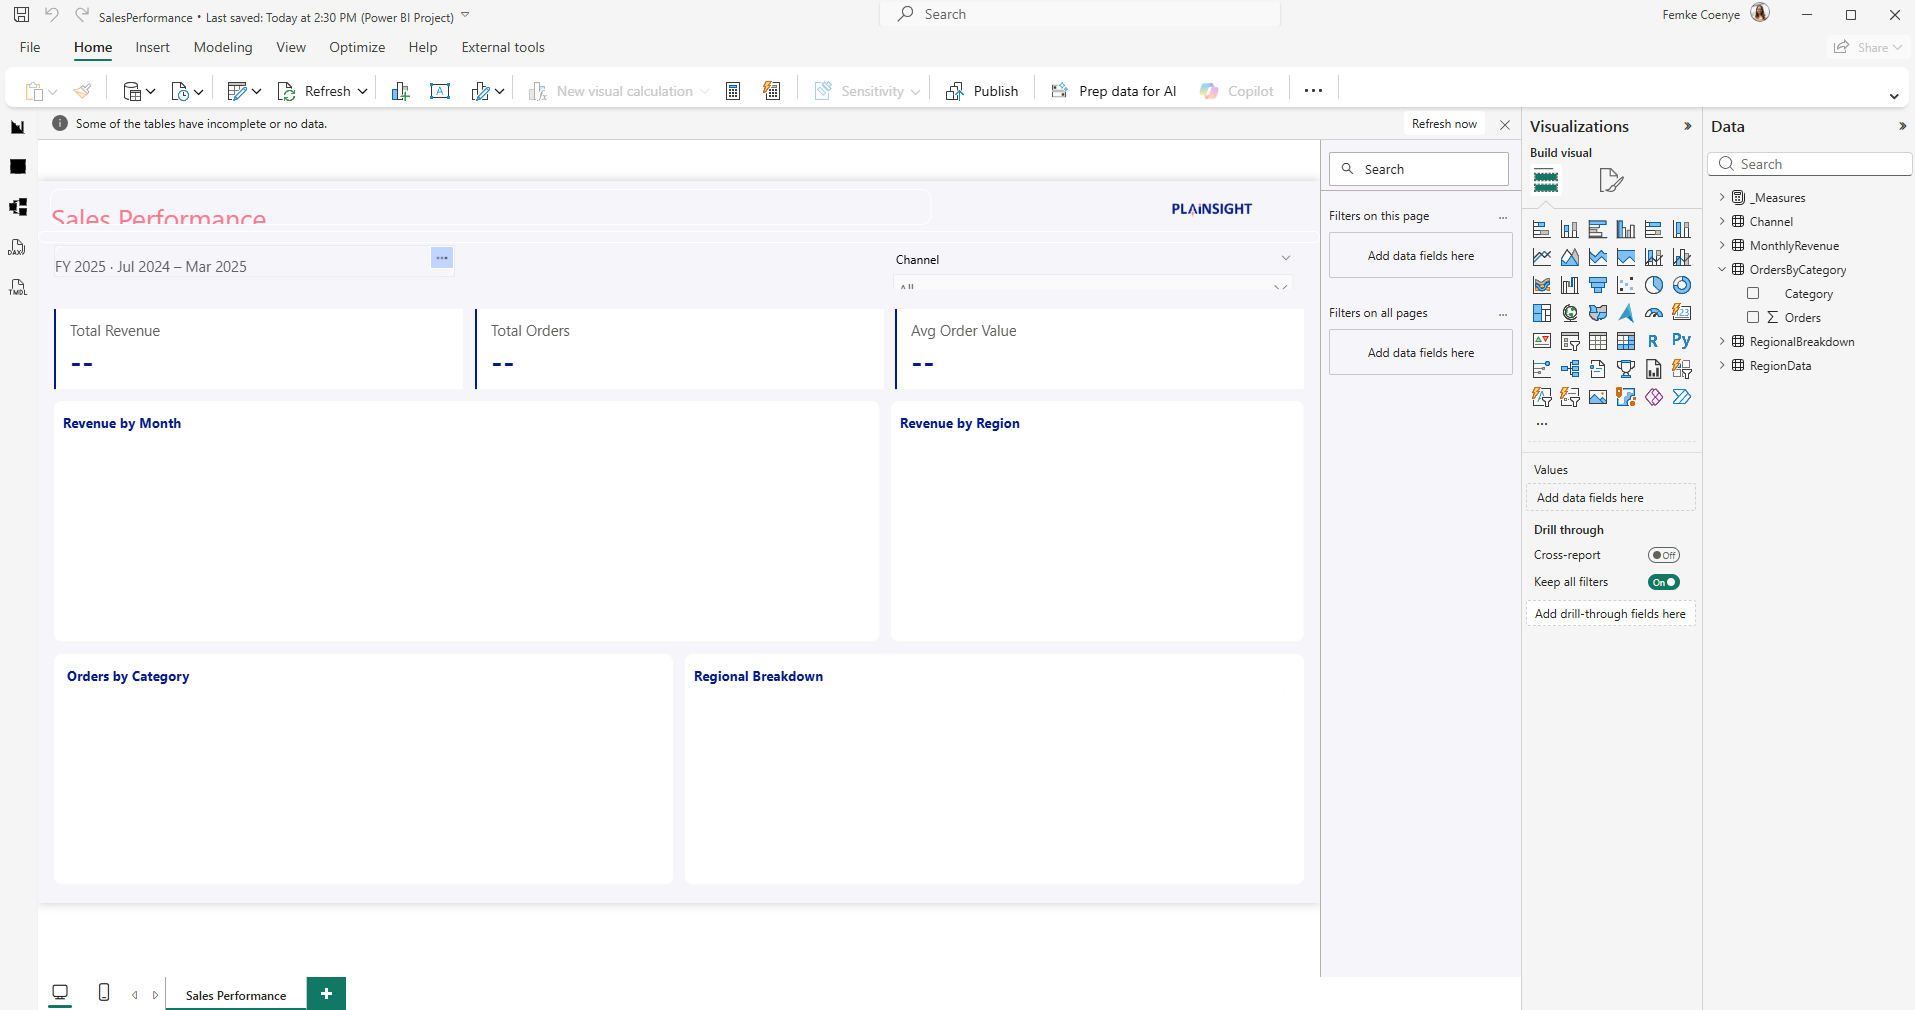
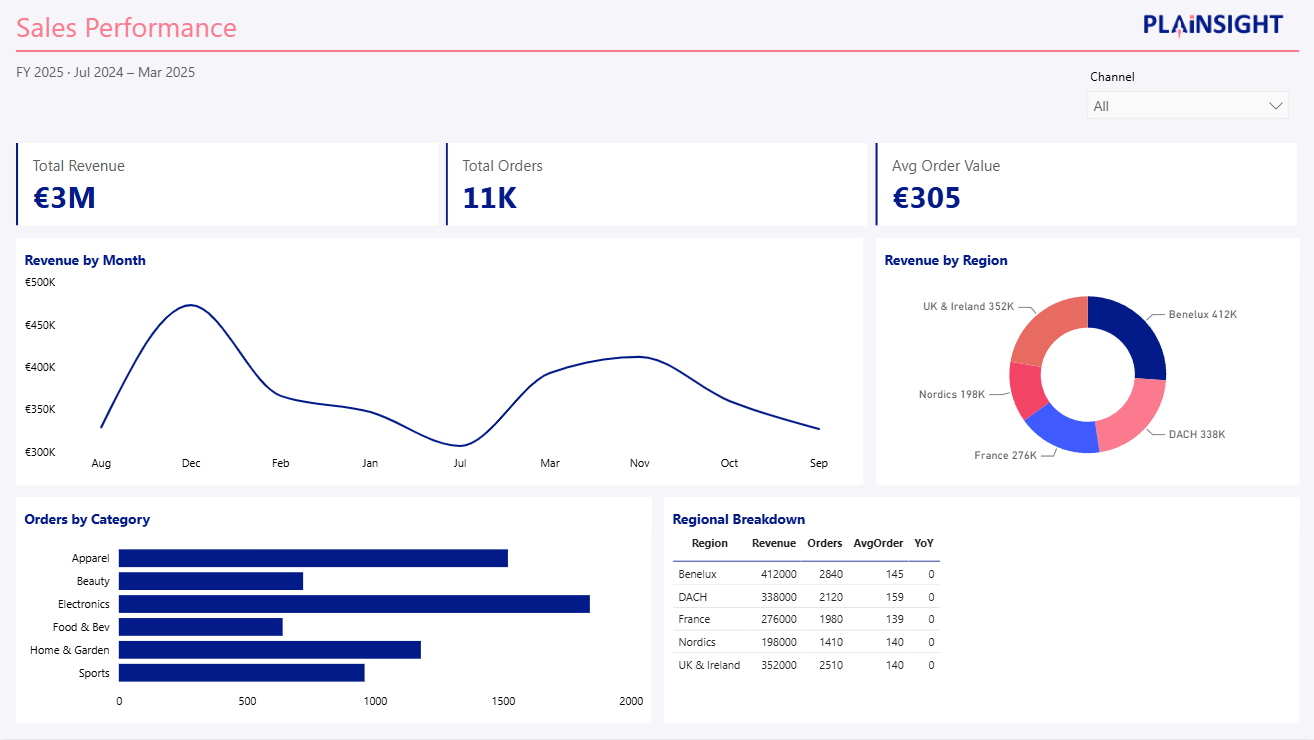
Here you can see the generated result with data loaded. Some small tweaks might still be needed, but it does not compare to building this report from scratch.
What to Verify (and What to Rebuild Manually)
When you open the generated project, there are three things to verify first:
- Theme and branding: confirm that the expected theme, colors, and logo have been applied.
- Field bindings: confirm that visuals resolve to real tables, columns, and measures without missing-field warnings.
- Visual rendering: confirm that each visual opens as the intended Power BI visual type and that the layout matches the prototype.
After that comes the part that is still normal Power BI development. Tooltips, drillthrough, bookmarks, row-level security, and page navigation are still things you should expect to finish manually in Desktop.
Closing: The Full Loop
This is the full loop. In the first step, AI helps you go from an idea to a prototype in minutes. In the second, that prototype becomes a structured Power BI starting point instead of a throwaway mock-up. And from there, the work in Desktop becomes focused report development rather than rebuilding the same layout by hand.
That is the real value of the workflow: idea, prototype, PBIP starting point, finished report. The investment is in building the skill carefully once. After that, you are buying back time every time a prototype turns into a real project.
If you want to use AI to shorten the path from requirements to a working report, feel free to reach out. I'm always happy to share ideas or help you integrate this into your own workflow.
Want to implement this in your workflow, too?

Femke Coenye
Femke is a certified Power BI Data Analyst with a background in front-end development and UI/UX design. She brings a visual eye to reporting that most data consultants don't have, which means her dashboards don't just work, they look like someone actually thought about the person reading them.