How I Use Claude to Build Power BI Prototypes in Minutes, Not Hours
Ever built a Power BI report, only to rebuild it after new feedback? I know I have, and it's frustrating.
This is exactly the kind of problem prototyping is meant to solve. Yet in practice, prototyping is often skipped, simply because it takes too much time.
But what if that trade-off no longer existed? What if you could generate realistic Power BI prototypes in minutes instead of hours?
In this article, I'll show how I use Claude to turn prototyping into a fast, repeatable process, and how you can do the same.
What Makes a Good Power BI Prototype?
Before we jump into using Claude, let's look at some common approaches, and why they often fall short.
A rough sketch on paper. Screenshots of existing visuals. Or jumping straight into Power BI.
These are all ways to create a "prototype", but none of them quite hit the mark:
- Sketches are too abstract. Stakeholders struggle to visualize the end result, leading to vague feedback.
- Screenshots are more realistic, but static. There's no interaction, filtering, or exploration.
- Building directly in Power BI feels efficient, but quickly turns into full development, making iteration slow and costly.
The issue isn't the idea of prototyping, it's the process. Creating something realistic enough for meaningful feedback still requires too much manual effort.
So what does a good prototype actually look like?
The primary goal is simple: get the right feedback as early as possible.
A strong prototype should be:
- Realistic (looks like the final report). If it looks real, stakeholders give more concrete and actionable feedback.
- Focused on layout and storytelling (not logic). You're validating structure and clarity, not DAX or the semantic model. The key question is: "Does this tell the right story?"
- Fast to create and iterate. If it takes too long, you won't use it.
- Built on representative (not perfect) data. The data should feel believable, even if it's not production-ready.
- Constrained by reality. Avoid designs that Power BI can't support. You don't want to create false expectations.
- Interactive enough to test usage. Basic interactivity (filters, drill-down, navigation) helps uncover usability issues early.
- Disposable by design. If you're afraid to change it, it's no longer a prototype.
A good prototype isn't a smaller version of the final report, it's a faster way to discover what the final report should be.
Why Traditional Prototyping Still Falls Short
A common approach is to use a prototype kit, for example a .PBIT template with reusable layouts and visuals.
This definitely helps. But you're still building layouts manually, and each iteration still takes time.
And that's the core problem: even with better tools, prototyping is still a manual process.
So what if you could skip most of that effort and generate a realistic starting point in minutes?
Turning Prototyping into a Repeatable Process (Using Claude)
Instead of building layouts yourself, you can use AI to generate realistic, website-like interfaces in seconds.
But on its own, this doesn't fully solve the problem.
You could start a new conversation with Claude each time and describe what you want, but that still means repeating the same instructions over and over again: layout, colors, visuals, structure.
While generation is fast, the setup is still manual.
That's where Claude Skills come in.
Why Claude?
There are multiple LLMs available today, but for this use case Claude has a few practical advantages:
- Strong structured output. Claude is very reliable when generating clean, well-structured code (like React components), which is essential for creating usable prototypes.
- Consistency across iterations. It tends to follow instructions closely, making it easier to maintain a consistent layout and design style across multiple prototypes.
- Skill-based workflow. The concept of "skills" makes it easy to define reusable instructions, assets, and constraints, perfect for building a repeatable prototyping process.
That said, the approach itself isn't exclusive to Claude, but the workflow is particularly smooth when using it.
What Are Claude Skills?
A Claude Skill is a reusable setup that defines how Claude should generate your prototypes.
Instead of repeating instructions every time, you bundle everything into one place:
- Instructions: how the prototype should be generated.
- Rules: constraints like layout, visuals, and best practices.
- Assets: themes, logos, and styling.
When you use a skill, Claude automatically applies all of these.
You can think of it as a predefined environment for your prototypes, one that ensures:
- Consistent design
- Realistic layouts
- Minimal effort per iteration
Instead of starting from scratch each time, you're giving Claude a structured way to generate exactly what you need.
Why This Matters
Without a skill, every prototype starts the same way: you describe the layout, the visuals, the styling, repeatedly.
With a skill, that setup is done once.
From that point on, you can focus on what actually matters:
What should this report show?
That's what turns prototyping from a one-off task into a repeatable process.
Building Your Power BI Prototyping Skill
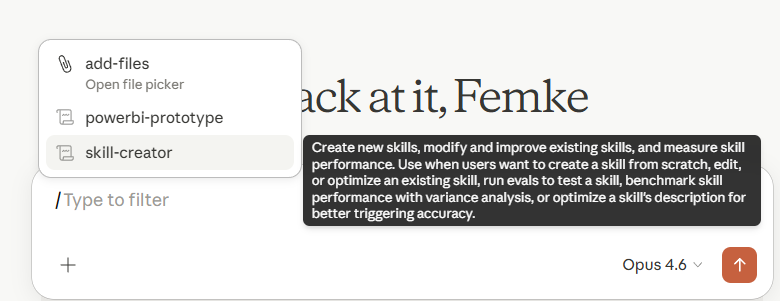
Creating a skill in Claude is really easy. There is a predefined skill called skill-creator. You can simply start your prompt with "Create a Power BI prototyping skill", and Claude will automatically use the skill-creator. Alternatively, you can type a slash in the text box to open the menu, which lets you select the skill manually.
I chose to use Opus, but this also works with other Claude models like Sonnet.
You could start there by simply asking Claude to create a Power BI prototyping skill and continue from that point.
However, you can also guide it in more specific directions to make the skill more relevant to your needs. For example, you may benefit from providing your JSON themes or logos to ensure a consistent brand experience.
Let's look at a few steps to take before you hit send.
Step 1: Gather your assets
As mentioned above, it is a good idea to tell Claude more specifically what the prototype should look like. This helps make the output feel more realistic.
You can do this by providing files such as:
- Logo images
- JSON themes
- Power BI templates (optional)
Additionally, you could include some sample data you would like to use in the prototypes.
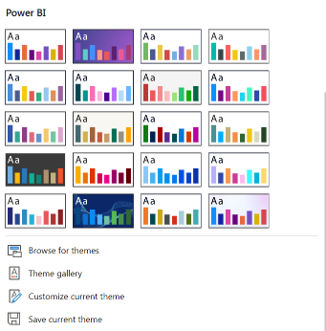
Not sure how to get a JSON theme? You can create one directly in the Power BI interface, by going into the View tab > Themes > Customize current theme. After making your changes, you can save the current theme as theme.json on your PC.
Want to be able to control more settings? Then these websites can help you out:
Step 2: Define your constraints
Next, it is important to think about the constraints that should be respected. For example, should the prototype only include native Power BI visuals? Can SVGs be used? Is there a restriction on canvas size to avoid scrolling?
Some useful questions to consider:
- Only native Power BI visuals?
- Allow SVGs?
- What level of detail is needed?
- Who is the target audience?
This step helps ensure that Claude returns output that is actually usable for your scenario.
Step 3: Build the skill
After defining all the specifics and constraints, you can ask Claude to start creating the skill. Don't forget to add any files relevant for your skill in the chat, like the theme.json file for example.
Personally, I kept my prompt very basic, only passing along the theme.json I wanted it to use. Based on this, Claude generated the following:
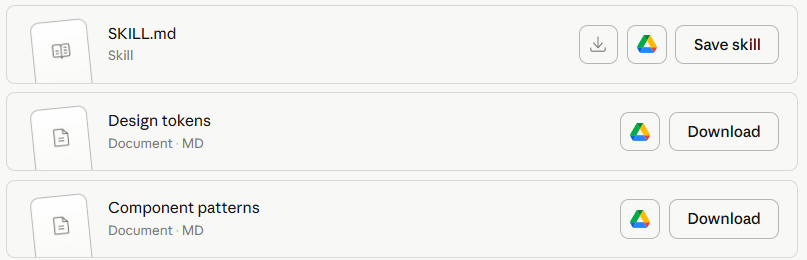
Here's what I built for you. The skill has three layers:
SKILL.md is the main instruction file. It tells Claude when to trigger (any PBI mockup, dashboard prototype, or data visualization request), what to read before coding, and every mandatory style rule extracted from your Plainsight theme. It also covers common mistakes to avoid (wrong fonts, purple gradients, visible gridlines, shadows, and so on), which are the things that typically cause inconsistency across generations.
design-tokens.md is a complete CSS variable block and lookup tables derived from your PS_Theme.json. This is the single source of truth for colors, typography, spacing, and visual-specific defaults (chart gridlines off, smooth lines, minimal tables, dropdown slicers, and so on). Every token maps directly back to a property in your theme file.
component-patterns.md holds copy-pasteable React patterns for the page shell, visual card wrapper, KPI cards, slicers, tables, and Recharts chart configurations, all pre-styled with the CSS variables. This gives Claude concrete structural starting points rather than improvising from scratch.
Want me to run a test prototype with this skill so you can see if the output matches your expectations?
When creating a skill, the output should always have a SKILL.md file. This is the core of the actual skill, in which Claude finds all the information it needs to start generating a prototype.
To save the skill, press the "Save skill" button. After doing that, you will find it back in the Customize menu, under Skills:
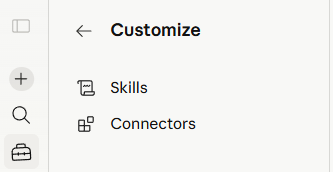
This view also lets you read the instructions stored in the powerbi-prototype:
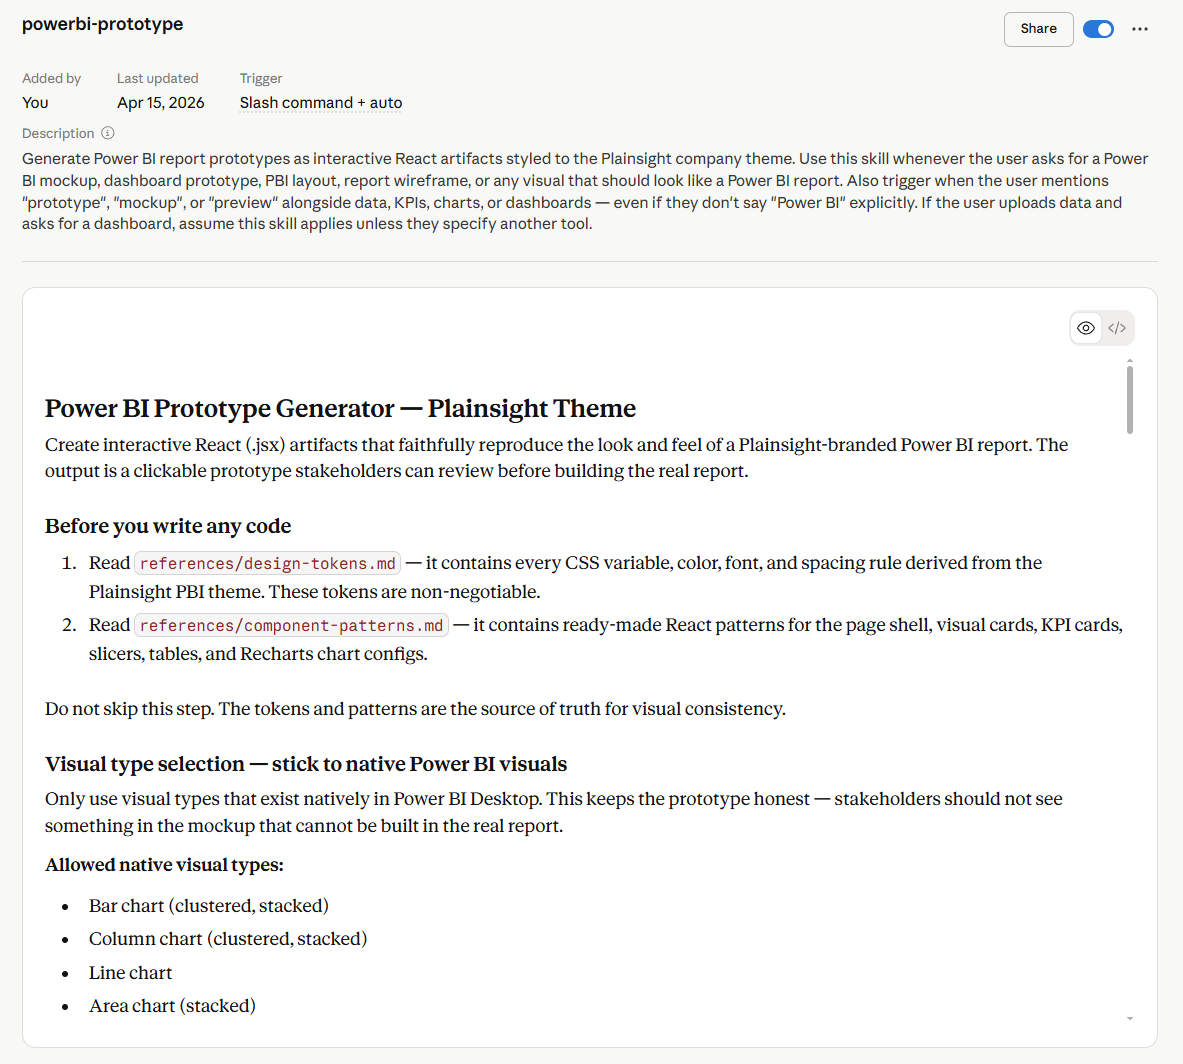
You can also use the skill in Claude Code. However, it is a bit more convenient to use this skill in the web interface, as that lets you view the generated output. To display React files on your desktop, you'd need to set up a specific environment, which isn't worth the hassle.
If you would prefer to work locally, you can use Claude Code in your favorite IDE, for example Visual Studio Code. I would suggest generating HTML for the prototype instead of React, as HTML is easier to view on desktop without requiring any installations. React just tends to do a bit better on interactivity, but HTML is definitely an option as well.
For using the skill on your desktop, simply download the files and place them in the .claude directory of your Claude project. Make sure to respect the folder structure:
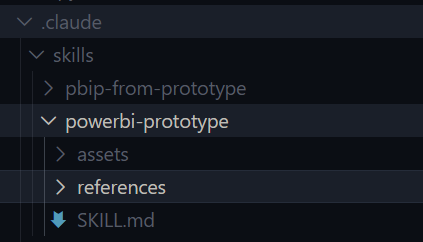
Make sure to:
- Add the skill in the /skills folder.
- Create a folder with the name of the skill: /powerbi-prototype.
- Add the SKILL.md file there (do not rename it).
- Add other files in the same subfolders as on the web interface.
After doing this, restart Claude Code or re-open your favorite IDE like Visual Studio Code.
Now you should be able to find and use your skill:
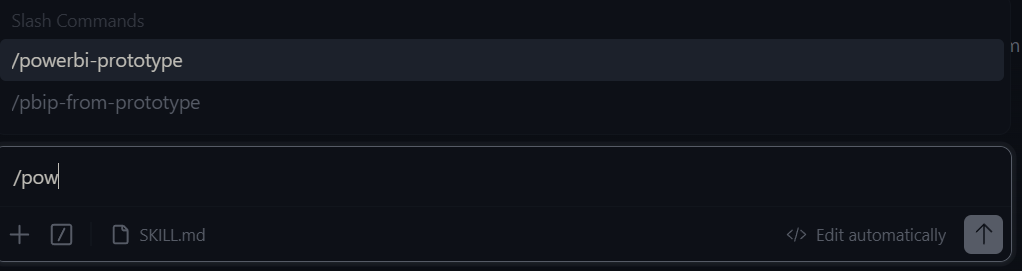
Step 4: Testing the skill
Now it is time to start playing around with the new skill. Ask Claude to create a prototype with /powerbi-prototype.
You can use this as an example prompt, or anything you would like: "Create a sales performance dashboard with revenue, orders, and regional breakdown."
Here you see the result of that prompt using the skill:
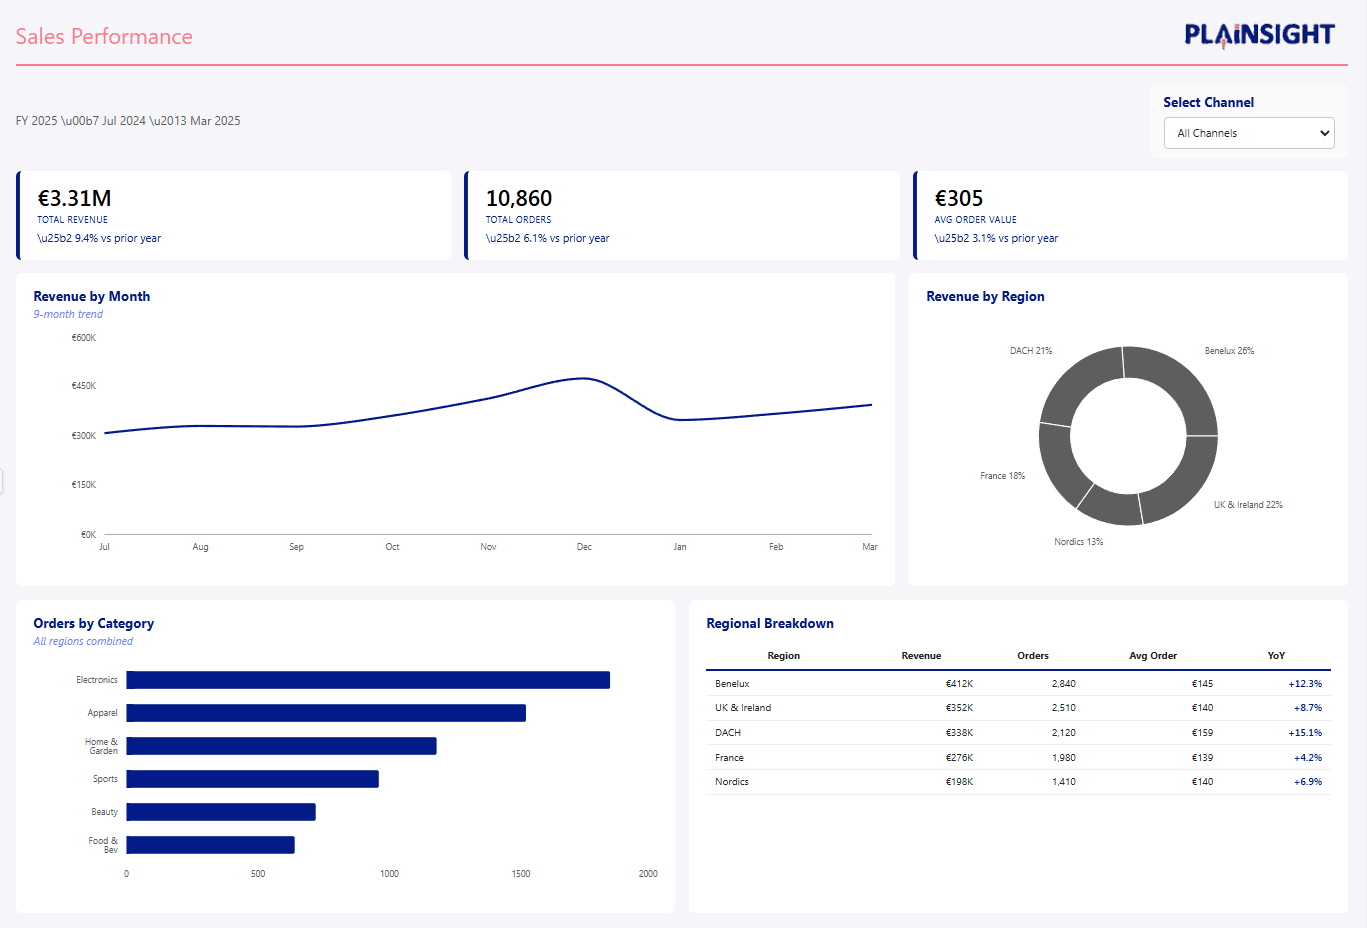
The result is already pretty good. The theme is respected, and it looks like a Power BI report, which is already a great start.
There might be some room for improvement, and by testing the skill you can find out how to tweak it to get consistent results that respect best practices and your preferences.
For this one, for example, it would be a good idea to ask Claude to modify the skill to respect Power BI best practices for visualization: when to use which visual? In this case specifically, Claude decided to use a donut chart for Revenue by Region.
This has several issues:
- The regions are all grey.
- Donut charts are not best practice for this type of visualization.
We might also want to ask Claude to respect the default canvas size of Power BI (16:9).
Modifying a skill is just as easy as creating one: just ask Claude to modify it. This returns an updated SKILL.md, and saving it updates the skill.
For desktop, download the new SKILL.md and any other files that changed, and replace the ones you previously had on desktop with the new ones.
Conclusion
Building Power BI reports without prototyping often leads to unnecessary rework and unclear feedback.
With tools like Claude, that trade-off starts to disappear. Prototyping is no longer a heavy upfront effort, but something lightweight and repeatable. Something you can actually fit into your workflow.
After all, a prototype isn't a smaller version of the final report. It's a way to discover what that report should be before you invest time building it.
Start prototyping instead of jumping straight into development. The real investment is no longer in each individual prototype, but in creating a reusable skill that helps you go from idea to prototype in minutes instead of hours or days.
And this is only the beginning. Once you have a solid prototyping workflow, the next step is bridging the gap to actual Power BI development, using similar approaches to move from prototype to a working .pbip project.
If you're exploring this approach or want help setting up your own workflow, feel free to reach out. I'm always happy to share ideas or help you get started.
Want to implement this in your workflow, too?

Femke Coenye
Femke is a certified Power BI Data Analyst with a background in front-end development and UI/UX design. She brings a visual eye to reporting that most data consultants don't have, which means her dashboards don't just work, they look like someone actually thought about the person reading them.