Power BI Meets AI: MCP, Copilot & Fabric Agents Explained
Let’s be honest about Power BI modeling
If you’ve ever spent a Friday afternoon renaming 300 columns to match a naming convention, translating measure descriptions into French, or explaining for the fifth time what a DAX measure actually does - you know that Power BI modeling can feel like a lot of manual labor.
The good news: that’s changing fast. Microsoft has been shipping AI capabilities into the Power BI and Fabric ecosystem at a serious pace. Three tools in particular stand out, and each one targets a different part of the workflow:
1. The Power BI Modeling MCP Server - for data modelers who build and maintain semantic models.** 2. Copilot for Power BI** - for report creators and business users who consume and explore data.** 3. Fabric Data Agents** - for the entire organization to ask questions across all data sources.
They don’t compete with each other - they complement each other. In this post, we’ll walk through all three, show practical use cases with real prompts, and give you step-by-step instructions so you can try them yourself today.
1. Power BI Modeling MCP Server
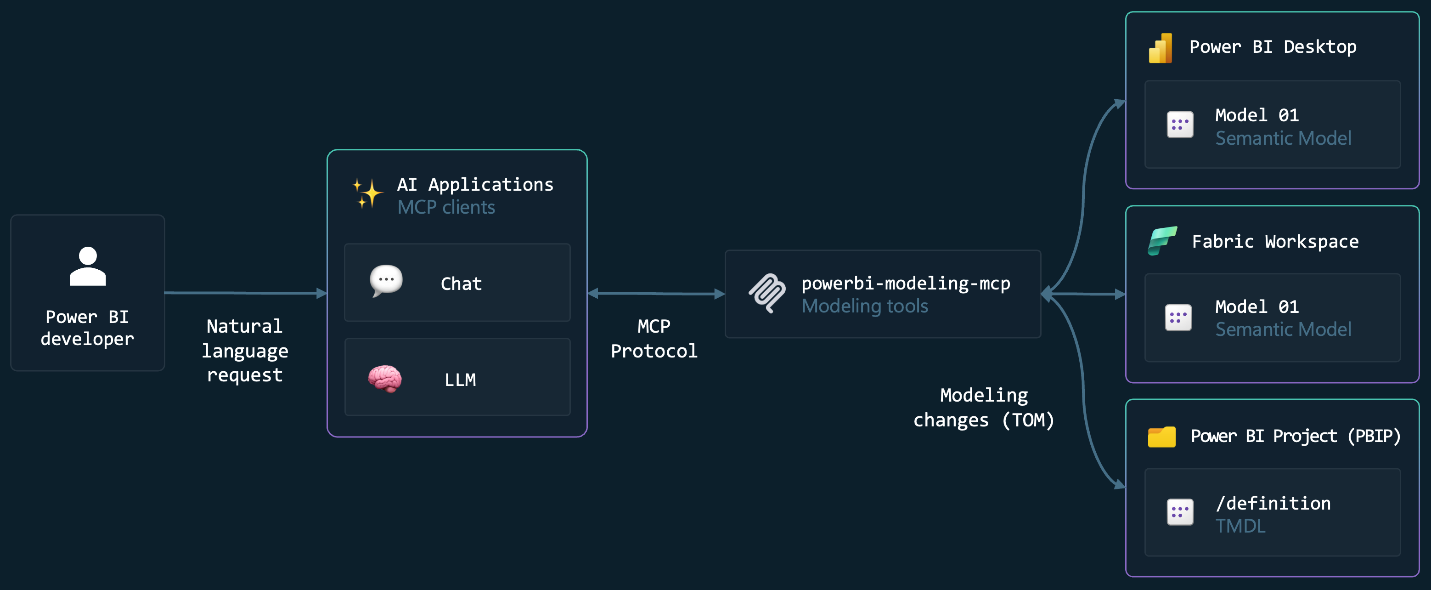
The Power BI Modeling MCP Server is an open-source tool by Microsoft that connects AI agents (like GitHub Copilot or Claude) directly to your Power BI semantic model. It implements the Model Context Protocol (MCP) - think of it as a USB-C port for AI. Any agent that speaks MCP can talk to your model.
It runs locally on your machine, uses your existing Entra ID credentials, and never stores tokens. The superpower? Bulk operations. Instead of clicking through the UI one object at a time, you describe what you want and the MCP server executes it across your entire model in seconds.
Use cases with example prompts
Naming conventions - Your model grew organically and column names are inconsistent. Ask the MCP to analyze and fix them:
Analyze the naming convention of the ‘Sales’ table and apply the same pattern across the entire model.
Model documentation - Your measures have no descriptions and there’s no overview of your model structure. Fix it in one go:
Add descriptions to all measures, columns, and tables to clearly explain their purpose and the logic behind the DAX code in simple terms.
Generate a Markdown document with professional documentation including a mermaid diagram for relationships, each measure with DAX code and business logic, RLS rules, and data sources.
Translations - You’re deploying to a Belgian organization that needs French and Dutch translations:
Generate a French translation for my model including tables, columns and measures.
DAX refactoring - You have dozens of repetitive time-intelligence measures. Consolidate them:
Refactor measures ‘Sales Amount 12M Avg’ and ‘Sales Amount 6M Avg’ into a calculation group and include new variants: 24M and 3M.
Power Query parameters - You want to switch data sources between Dev, Test, and Prod without editing every table:
Analyze the Power Query code for all tables, identify the data source configuration, and create semantic model parameters to enable easy switching.
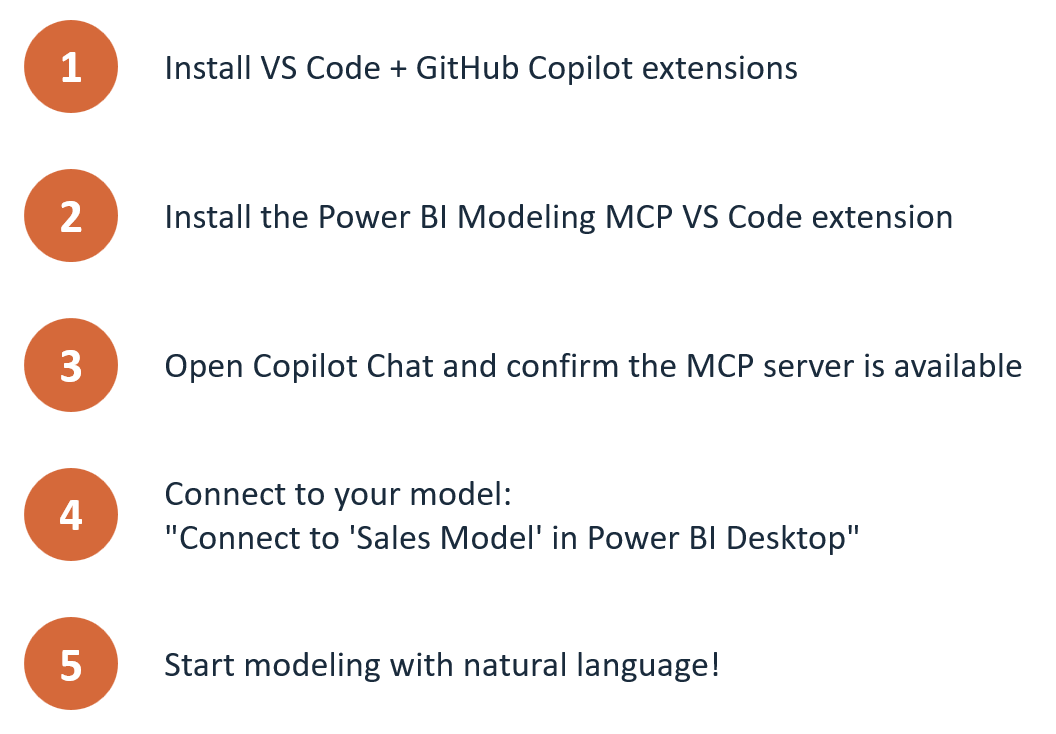
Getting started with the MCP Server
2. Copilot for Power BI
While the MCP server is for modelers in VS Code, Copilot lives inside Power BI itself - in the report Copilot pane, as a standalone experience at app.powerbi.com/copilot, in apps, and on mobile.
Use cases with example prompts
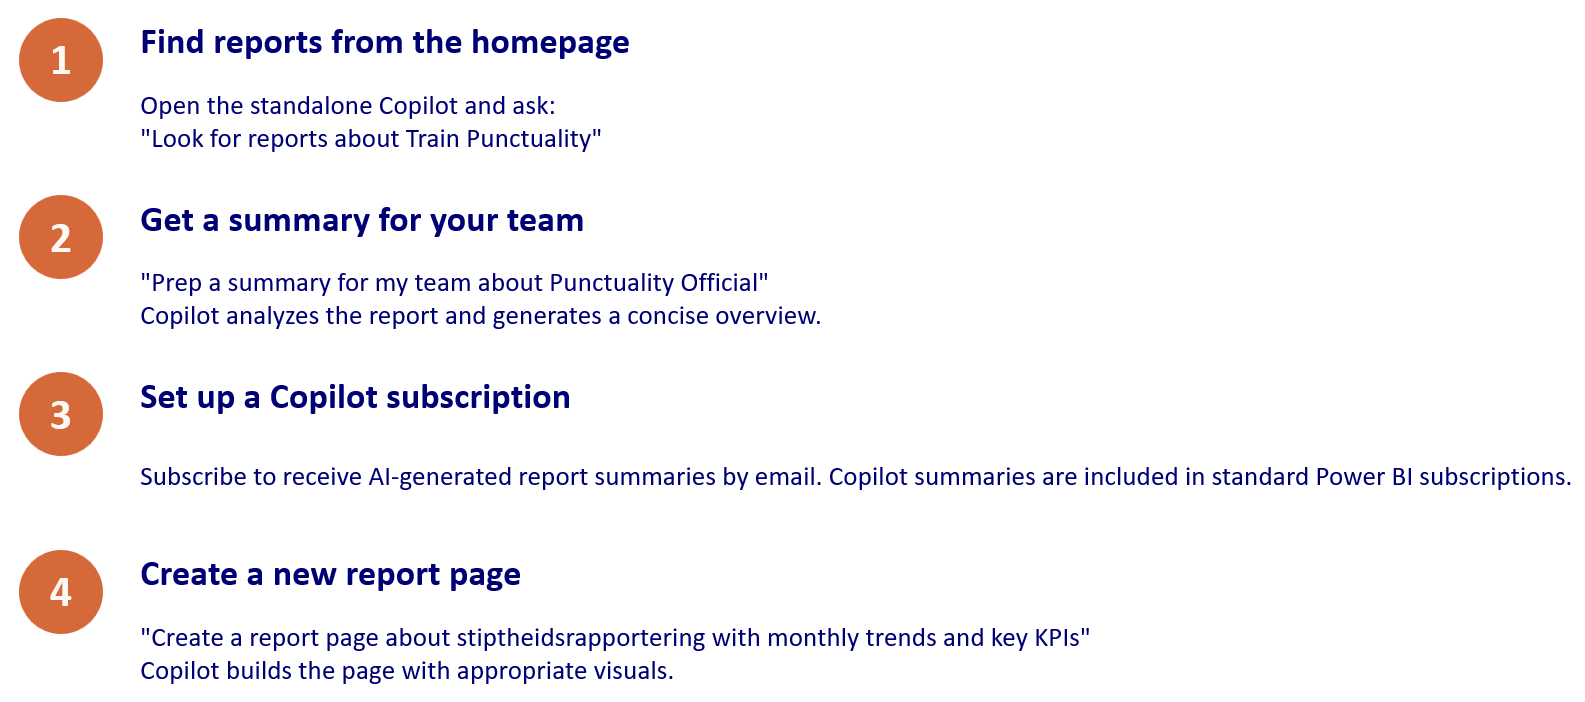
Find reports across your tenant - Open the standalone Copilot and search:
Look for reports about Train Punctuality
Copilot scans all items you have access to and surfaces the most relevant reports.
Summarize a report for your team - You need to brief your manager before a meeting:
Prep a summary for my team about Punctuality Official
Copilot reads the report visuals, applies filters, and generates a concise narrative. You can also set up a Copilot subscription to email AI-generated summaries on a schedule.
Create a full report page - You need a new page and don’t want to drag fields manually:
Create a report page about monthly punctuality trends with KPIs and a breakdown by region
Copilot picks the right visuals, selects fields from your model, and builds the page. You can then iterate: add visuals, change chart types, or delete elements - all through conversation.
Generate a DAX measure - You need a year-over-year calculation:
Create a measure that calculates year-over-year sales growth as a percentage
Copilot writes the DAX, and you can review and edit before adding it to your model.
Auto-generate measure descriptions - In Desktop or web modeling, click the Copilot button next to any measure to generate a description. Critical for live-connected consumers who can’t see the DAX.** Getting started with Copilot**
3. Fabric Data Agents
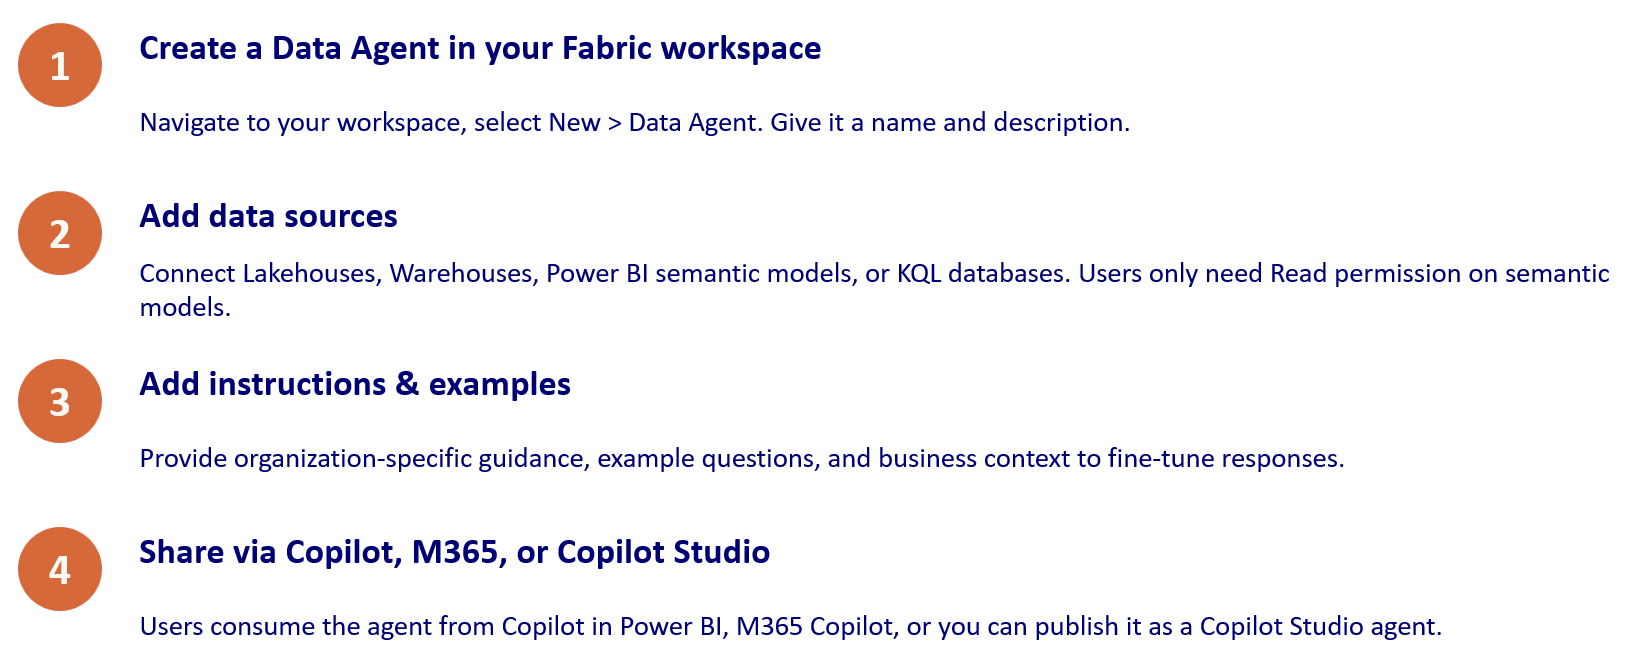
Fabric Data Agents are the newest piece of the puzzle. Think of them as virtual analysts you can build for specific domains. A data agent sits on top of your Lakehouses, Warehouses, Power BI semantic models, KQL databases, ontologies, and even Microsoft Graph - and lets anyone in your organization ask questions in plain language.
The key difference from Copilot: agents are read-only (they query data but never modify it), they can query** across multiple data sources at once however can't combine different sources. T**hey’re consumable from many surfaces - Copilot in Power BI, M365 Copilot, Copilot Studio, and via MCP server endpoints. Users only need Read permission on the underlying semantic model.
Use cases
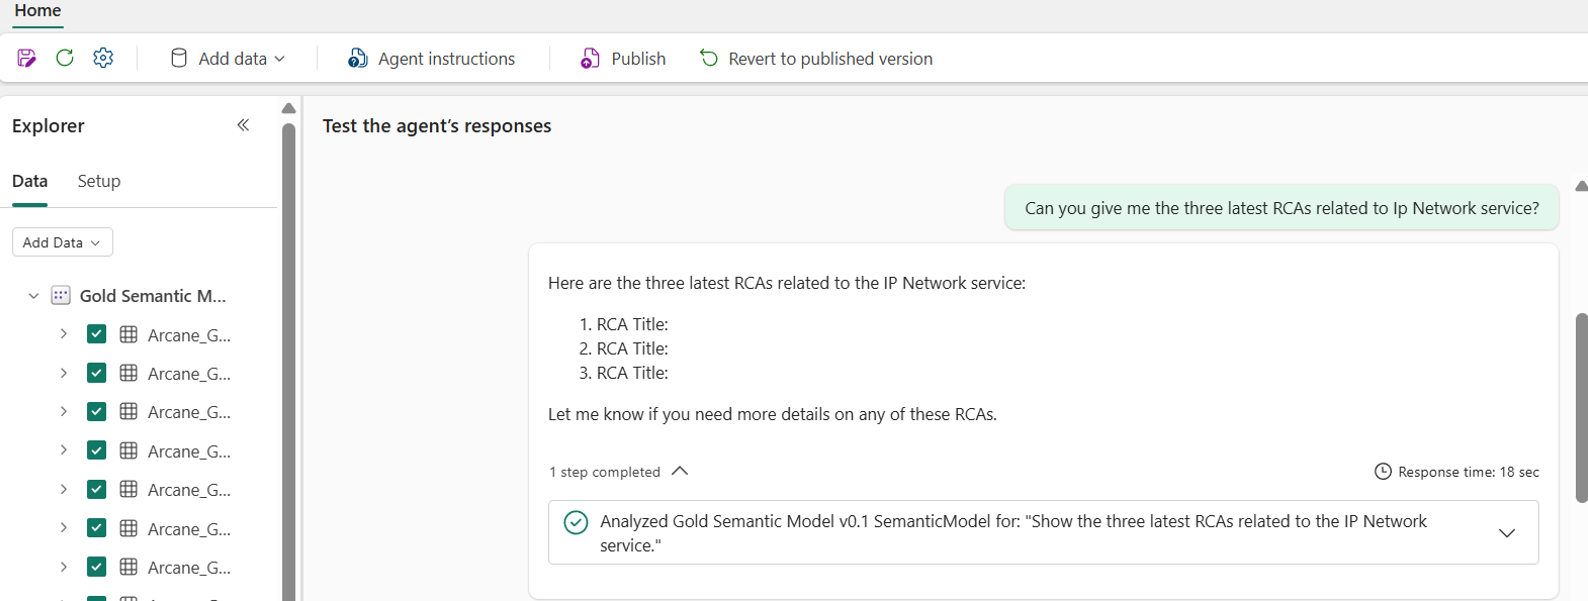
Domain-specific Q&A - Build a “Sales Agent” that connects to your sales warehouse and semantic model. Any sales manager can ask:
What were our top 5 products by revenue in Q1 2026?
The agent identifies the right data source, generates a query (SQL or DAX), executes it, and returns a human-readable answer - all governed by RLS and Purview policies.
Cross-source analysis - Your data lives in a Lakehouse and a Power BI semantic model. A single agent can query both:
Compare the customer count in our warehouse raw data vs. the published semantic model
Getting started with Fabric Data Agents
So which one should I use?
All three. They each serve a different persona:
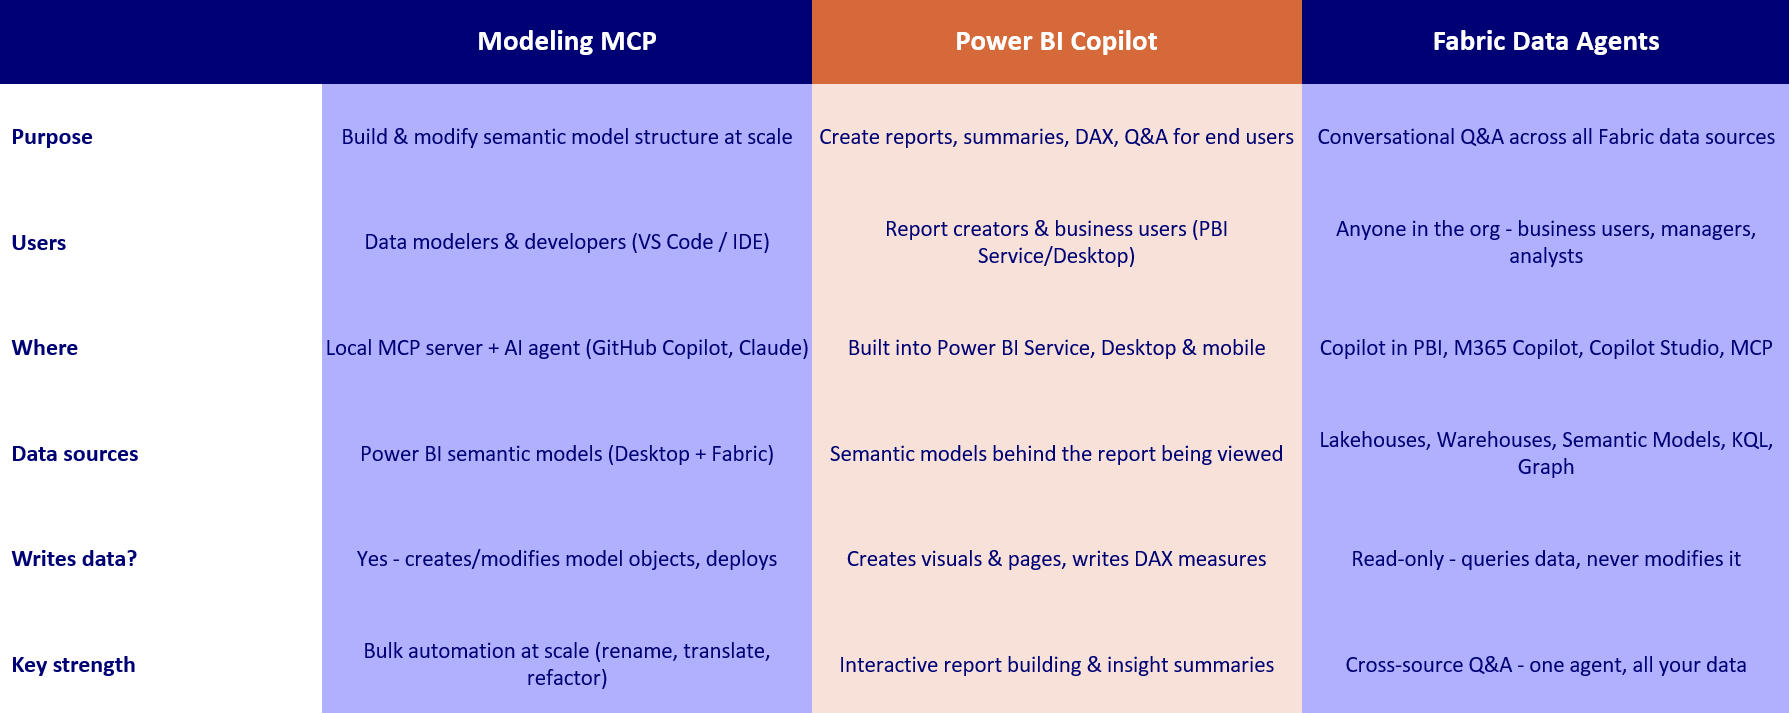
The Modeling MCP Server is for developers who build the semantic model - schema-level bulk automation (rename, translate, refactor, deploy). Copilot for Power BI is for report creators and business users - report-level interactive exploration (build pages, write DAX, summarize). Fabric Data Agents are for the entire organization - read-only cross-source Q&A accessible to anyone with permissions.
The pipeline: MCP builds the model → Copilot creates reports and insights → Fabric Agents open Q&A to everyone.
Get started today!
At Plainsight, we help organizations get more out of Power BI - from Fabric architecture and semantic model optimization to hands-on AI enablement with MCP, Copilot, and Fabric Data Agents. No theory, just implementation.
Curious what AI could do for your workflow? Reach out at info@plainsight.pro!
*Further reading: Power BI Modeling MCP · Copilot · Fabric Data Agents
Want to implement this in your workflow, too?

Lou Segers
Lou is a Power BI expert with a strong focus on data modeling using the Kimball methodology. He's proficient in SQL and active in the dataMinds community. He builds the kind of semantic models that make self-service reporting actually work for the people using it.