
Translate Your Data & Analytics Capabilities to Business Outcomes
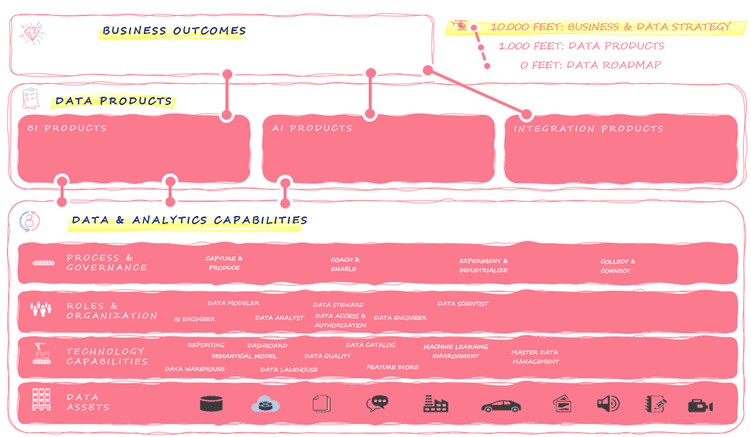
Plenty of organizations have dashboards, models, and a capable data team, yet struggle to say which business outcome any of it serves. That missing link is what the framework in the infographic above is built to fix. It connects business strategy at the top to data assets at the bottom, with everything in between accounted for.
Business Outcomes: The Pinnacle of Strategy
Everything starts with what the business wants: more revenue, better customer satisfaction, operational efficiency, a stronger competitive position. When a data initiative can't be traced back to one of those goals, it tends to become a science project. So we start here, and only then work downwards. That is how every data initiative stays tied to the business strategy instead of running alongside it.
Data Products: The Translators of Strategy
One level down sit the data products: the tangible outputs of your data strategy. We work with three types.
**BI Products**: dashboards, reports, and visualizations that give a clear view of your key performance metrics, so decisions rest on numbers instead of gut feeling.**AI Products**: machine learning applications that automate processes, predict trends, and find patterns in your data that no human would spot.**Integration Products**: the plumbing that moves data reliably between systems and platforms. Less visible than the other two, and the reason the other two can be trusted: they keep data intact and analyzable across the whole organization.
Data & Analytics Capabilities: The Backbone of Excellence
Data products don't appear out of thin air. Underneath them sit the capabilities that make building and running them possible.
**Process & Governance**: the policies, procedures, and standards that keep data quality, security, and compliance in order. Without them, trust in the numbers erodes fast.**Roles & Organization**: clear roles with clear responsibilities. Think Data Modeler, BI Engineer, Data Analyst, Data Steward, Data Scientist, and Data Engineer, each covering a specific part of the work.**Technology Capabilities**: the stack that does the heavy lifting: reporting tools, dashboards, data warehouses, data lakehouses, semantic models, data quality solutions, data catalogs, machine learning environments, and master data management systems.**Data Assets**: the raw material itself. Structured and unstructured data from databases, cloud services, IoT devices, social media, and more. Everything above this layer is only as good as what sits here.
A Unified Approach
The point of the infographic is the connections. Business outcomes determine which data products to build, data products determine which capabilities you need, and capabilities determine what you can do with your data assets. Along that chain, organizations capture, produce, enable, experiment, industrialize, and connect data until it delivers outcomes the business actually cares about.
That is the work we do with our clients, end to end: turning data into decisions and results. Want to see what this framework looks like applied to your organization? Contact us and we'll show you.
Want to implement this in your workflow, too?

David Loos
David is co-founder of Plainsight and has been in data and analytics for well over fifteen years. He's held every role from developer to program manager, and has led data strategy and architecture for organizations like Delhaize, VDAB, Fluvius, and Barco. He completed Vlerick's Advanced Management Programme, which says as much about how he thinks about business as it does about data.