
Save Future You Time with Auto-Generated Color Measures
Introduction
Color is one of the most repetitive and time consuming parts of Power BI report development. Setting button hover states, adjusting pressed colors, choosing the right accent shade, matching borders and backgrounds: many of these steps still can't be fully handled by a JSON theme. As a result, developers spend far too much time clicking through formatting menus instead of doing actual analytics.
And the moment someone updates the brand guidelines, you get to do it all over again.
So why not treat color like code?
In this blog, we focus specifically on creating a reusable, maintainable color system in Power BI. We'll look at how to structure color measures, how to name and scale them correctly, and how to automatically generate all your shades using either a C# script (Tabular Editor) or Python (PBIP format). With a solid color setup in place, you can refresh your entire report's look in minutes instead of hours. Future you will be very grateful.
Color Measures (and Why They Are Worth It)
A JSON theme gets you far, but button states other than default (hover, pressed, disabled) still need manual configuration. That's where color measures shine: one central place for every color, reusable across visuals through conditional formatting with Field value.
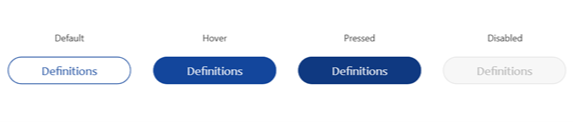 Just imagine how long it would take to reconfigure the colors on all button states by hand. When measures are used as the field value for the conditional formatting, changing these blue shades to something entirely different is a quick job.
A Simple Color Measure (example)
Color - Primary 200 = "#3A7BFA"
Use it in any visual property that supports conditional formatting with Field value (e.g., Fill, Border, Font color).
Creating color measures
The first step is adding the color measures. The obvious approach: add every color in your theme as a measure and be done with it. It's a step in the right direction, but not very dynamic or future proof.
Following this approach, we would add the blue shade used in the default and hover states of the button like this:
 While this solution works, we might find that changing the color of the button afterwards still takes a lot of time. If the button color needs to change from blue to green, we would have two options.
Update "Color - Blue" and give it a different hex code matching the requested shade of green.Replace the field value measure with "Color - Green" for all necessary properties of the button.
Option one is the least effort, but then the measure name is wrong. Option two takes the same amount of time as not using measures for your colors at all.
A scalable naming convention for colors
Instead of naming colors by the hue (e.g., "Blue"), name them by semantic role (Primary, Secondary, Accent1, Accent2). Then add a 3-digit shade suffix that scales lighter/darker:
- 000 (lightest), 050, 100, 200 (base), 300, 400, 500 (darkest)
This mirrors widely used design scales and gives you predictable control.
Examples
Color - Primary 200
Color - Secondary 300
Color - Accent2 050
Why 200 as base? It leaves room on both sides for lighter and darker variants without running out of numbers too soon.
Semantic roles:
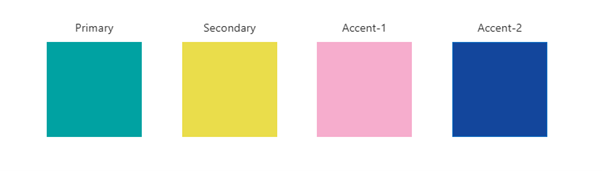
Full names: semantic + shade suffix
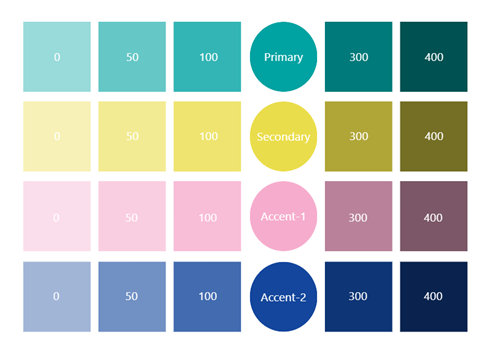 This means that we would have the following color variations for the blue color used in the buttons above:
Color - Accent2-0
Color - Accent2-50
Color - Accent2-100
Color - Accent2-200 (this is the main shade, visualized in the circle)
Color - Accent2-300
Color - Accent2-400
In this set-up, the number at the end will indicate the light-/darkness of the shade, with 200 always indicating the standard variation.
Automating color measures
Creating 20 to 30 measures is a one-time investment, but you can automate it completely.
Option 1: C# Script (Tabular Editor)
If you are working with PBIX files, this option is for you. With this approach, color measures are automatically generated in the Semantic Model.
Before we get to the script itself, here are the steps it goes through.
Step 1 - Extracting colors from Theme.json
In this step, the C# script reads the JSON file in which your current theme is defined. To do that, you need to pass the exact path to the file on your device.
In the Theme.json file, the script will extract the HEX codes for the colors from the dataColors property in which the theme colors are defined.
These dataColors are the colors you see in the first row of the color picker (besides black and white). In the Customize theme menu you can find them under "Theme colors".
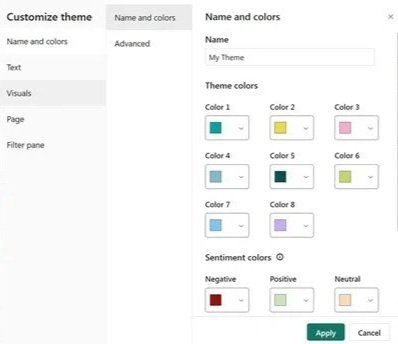
Step 2 - Create base colors
With the hex codes extracted, the script creates the base color measures in the table and display folder you specified.
Each measure gets a structured name and a specific display folder based on the order. In case you named the main Display folder "Colors", the result looks like this:
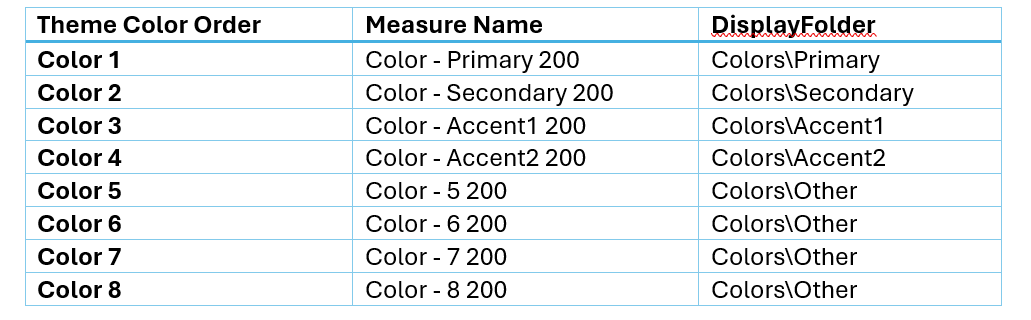
The script can of course be modified to your preferences. You could opt to only add the first four data colors as measures for example, or to name them differently.
Step 3 - Create variations
In the final step, the script will generate dark and light variations for the theme colors. If we look at our Power BI interface again, you can see that each theme color also has some variations available:
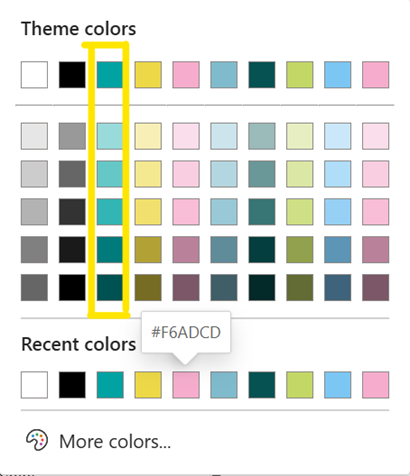
When looking at the first line, we see the "main" color which will be created as the measure "Color - Primary 200" by the script. On the rows below, there are several variations that represent shades of the main color.
As these are not listed in the Theme.json file, the script generates these variations itself.
By setting a factor by which to respectively "lighten" or "darken" the main colors, we can generate new Hex codes.
To do this, the script will convert the Hex code of the main color to its Red Green Blue (RGB) components and then use the factor to generate the shades.
These new shades will be named like this:
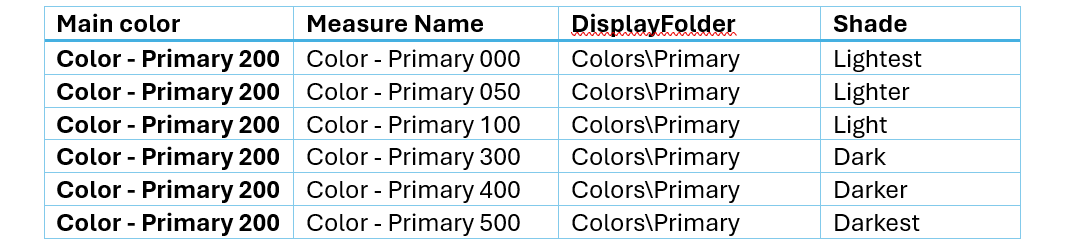
Within the script you can control which suffixes to use for the shades, and how many shades you want to generate.
The script
using Newtonsoft.Json.Linq;
using System.Collections.Generic;
using System.Linq;
/*
// Variables
*/
// Path to your theme file
string themeFilePath = @"C:\Users\user\folder\Theme.json"; // <-- Change this to the path to your JSON Theme
// Target table in the model
var targetTable = Model.Tables; // <-- Change this to table in the model where colors should be added
// Display folder for colors
string displayFolder = "01 - Colors";
// Color Names
string measurePrefix = "Color - "; // This will be the start of your color measure name
string color1 = "Primary";
string color2 = "Secondary";
string color3 = "Accent1";
string color4 = "Accent2";
string color5 = "Other";
// Define suffix arrays for shades
string lighterSuffixes = { "100", "050", "000" };
string darkerSuffixes = { "300", "400", "500" };
// Set factor to lighten/darken colors
double factorLight = 0.15;
double factorDark = 0.15;
/*
// Step 1 - Extract Theme Colors
*/
// Read JSON
string jsonContent = System.IO.File.ReadAllText(themeFilePath);
var json = JObject.Parse(jsonContent);
// Extract colors
var colors = new List
{ foreach (var c in json) { colors.Add(c.ToString()); }}
if (colors.Count == 0) { Info("No colors found in 'dataColors'."); return;}
/*
// Step 2 - Add Color measures to table
*/
// Get target table
if (targetTable == null)
{ Error("Table " + targetTable + " not found."); return;}
// Create measures for each color
int index = 1;
foreach (var color in colors)
{
// Determine base name and subfolder
string baseName;
string subFolder;
if (index == 1) {baseName = measurePrefix + color1; subFolder = color1; }
else if (index == 2) { baseName = measurePrefix + color2; subFolder = color2; }
else if (index == 3) { baseName = measurePrefix + color3; subFolder = color3; }
else if (index == 4) { baseName = measurePrefix + color4; subFolder = color4; }
else if (index == 5) { baseName = measurePrefix + color5; subFolder = color5; }
else { baseName = null; subFolder = null; }
// If baseName is null, skip creating measures

if (baseName == null || subFolder == null)  {index++;continue;  }

// Base measure
string baseMeasureName = baseName + " 200";

// Only add  measure if it does not exist yet
if (!targetTable.Measures.Any(m => m.Name == baseMeasureName))
{
    var baseMeasure = targetTable.AddMeasure(baseMeasureName, "\\"" + color + "\\"");
    baseMeasure.DisplayFolder = displayFolder + "\\\\" + subFolder;
}
else    {Info("Measure '" + baseMeasureName + "' already exists. Skipping."); }
/*
// Step 3 - Generate Color Shades
*/
// Convert HEX to RGB

string hex = color.Trim();
int r = Convert.ToInt32(hex.Substring(1, 2), 16);
int g = Convert.ToInt32(hex.Substring(3, 2), 16);
int b = Convert.ToInt32(hex.Substring(5, 2), 16);


// Generate lighter shades

for (int i = 0; i < lighterSuffixes.Length; i++)
{
    double factor = (i + 1) \* factorLight;
    int nr = (int)(r + (255 - r) \* factor);
    int ng = (int)(g + (255 - g) \* factor);
    int nb = (int)(b + (255 - b) \* factor);

    nr = nr > 255 ? 255 : nr;
    ng = ng > 255 ? 255 : ng;
    nb = nb > 255 ? 255 : nb;

    string newHex = "#" + nr.ToString("X2") + ng.ToString("X2") + nb.ToString("X2");
    string newName = baseName + " " + lighterSuffixes;

    // Only add measure if it does not exist
    if (!targetTable.Measures.Any(m => m.Name == newName))
    {
        var newMeasure = targetTable.AddMeasure(newName, "\\"" + newHex + "\\"");
        newMeasure.DisplayFolder = displayFolder + "\\\\" + subFolder;
    }
    else  {  Info("Measure '" + newName + "' already exists. Skipping."); }
}


// Generate darker shades
for (int i = 0; i < darkerSuffixes.Length; i++)
{
    double factor = (i + 1) \* factorDark;
    int nr = (int)(r - (r \* factor));
    int ng = (int)(g - (g \* factor));
    int nb = (int)(b - (b \* factor));

    nr = nr < 0 ? 0 : nr;
    ng = ng < 0 ? 0 : ng;
    nb = nb < 0 ? 0 : nb;

    string newHex = "#" + nr.ToString("X2") + ng.ToString("X2") + nb.ToString("X2");
    string newName = baseName + " " + darkerSuffixes;


     // Only add measure if it does not exist
    if (!targetTable.Measures.Any(m => m.Name == newName))
    {
        var newMeasure = targetTable.AddMeasure(newName, "\\"" + newHex + "\\"");
        newMeasure.DisplayFolder = displayFolder + "\\\\" + subFolder;
    }
    else  {  Info("Measure '" + newName + "' already exists. Skipping.");  }
}
index++;
}
Info("Created " + colors.Count + " color measures plus shades in subfolders.");
Option 2 - PBIP + Python Script
If you prefer the new PBIP format, you can use a Python script to achieve the same result, with one noteworthy benefit:
While Option 1 uses Tabular Editor and therefore adds the measures to the model, using the PBIP format means we can decide whether we want the measures to be added in the report layer or the model.
The steps are largely the same, so we will not spell them out again and just share the code with you.
import json
from pathlib import Path
# ------------------------------------------------------------------------------------------------------------
# CONFIG - adjust these as needed
# ------------------------------------------------------------------------------------------------------------
report_dir = Path.cwd() # assumes script run from "
theme_path = report_dir / "StaticResources" / "SharedResources" / "BaseThemes" / "CY24SU02.json"
# How many base dataColors to read
MAX_DATA_COLORS = 5
# Friendly names for each index
NAME_MAP =
# Shade levels to generate for each base color
# Key = suffix number in measure name, Value = lighten (positive) or darken (negative) percentage
SHADE_LEVELS = {
0:   +0.30,   # lighten 30%

50: +0.20,   # lighten 20%

100: +0.10,   # lighten 10%

200:  0.00,   # original color

300: -0.10,   # darken 10%
400: -0.20, # darken 20%
500: -0.30 # darken 30%
}
# ------------------------------------------------------------------------------------------------------------
# COLOR HELPERS
# ------------------------------------------------------------------------------------------------------------
def hex_to_rgb(h):
h = h.lstrip("#")

return tuple(int(h, 16) for i in (0, 2, 4))
def rgb_to_hex(rgb):
return "#{:02X}{:02X}{:02X}".format(

    max(0, min(255, int(rgb))),

    max(0, min(255, int(rgb))),

    max(0, min(255, int(rgb)))

)
def blend_color(hexcolor, factor):
"""

factor > 0 ? lighten toward white

factor < 0 ? darken toward black

"""

r, g, b = hex\_to\_rgb(hexcolor)

if factor > 0:

    r = r + (255 - r) \* factor

    g = g + (255 - g) \* factor

    b = b + (255 - b) \* factor

else:

    factor = abs(factor)

    r = r \* (1 - factor)

    g = g \* (1 - factor)

    b = b \* (1 - factor)

return rgb\_to\_hex((r, g, b))
# ------------------------------------------------------------------------------------------------------------
# JSON UTILITIES
# ------------------------------------------------------------------------------------------------------------
def load_json(path: Path, default: dict = None):
if path.exists():

    with open(path, "r", encoding="utf-8") as f:

        return json.load(f)

return default if default is not None else {}
def save_json(path: Path, data: dict):
path.parent.mkdir(parents=True, exist\_ok=True)

with open(path, "w", encoding="utf-8") as f:

    json.dump(data, f, indent=2, ensure\_ascii=False)
def ensure_report_extensions(report_definition_dir: Path):
path = report\_definition\_dir / "reportExtensions.json"

if not path.exists():

    skeleton = {

        "$schema": "https://developer.microsoft.com/json-schemas/fabric/item/report/definition/reportExtension/1.0.0/schema.json",

        "name": "extension",

        "entities":

    }

    save\_json(path, skeleton)

return path
def make_measure(name, hex_value):
return {

    "name": name,

    "dataType": "Text",

    "expression": f"\\"{hex\_value}\\""

}
def upsert_measure(measures, new_m):
names = {m: idx for idx, m in enumerate(measures)}

if new\_m in names:

    measures\]\] = new\_m

else:

    measures.append(new\_m)
# ------------------------------------------------------------------------------------------------------------
# Load theme & extract ONLY dataColors
# ------------------------------------------------------------------------------------------------------------
def collect_data_colors(theme):
data\_colors = theme.get("dataColors", )

if not isinstance(data\_colors, list):

    return

return data\_colors
# ------------------------------------------------------------------------------------------------------------
# Locate PBIR structure
# ------------------------------------------------------------------------------------------------------------
definition_dir = report_dir / "definition"
if not definition_dir.is_dir():
raise FileNotFoundError("PBIR definition folder not found")
report_extensions_path = ensure_report_extensions(definition_dir)
report_extensions = load_json(report_extensions_path)
entities = report_extensions.setdefault("entities", )
entity = next((e for e in entities if e.get("name") in ), None)
if entity is None:
entity = {"name": "00 - Generic", "measures": }

entities.append(entity)
entity.setdefault("measures", )
measures_list = entity
# ------------------------------------------------------------------------------------------------------------
# CREATE MEASURES (base + shades)
# ------------------------------------------------------------------------------------------------------------
theme_json = load_json(theme_path)
colors = collect_data_colors(theme_json)
for i, base_hex in enumerate(colors, 1):
friendly = NAME\_MAP if i <= len(NAME\_MAP) else f"Color{i}"

for shade, factor in SHADE\_LEVELS.items():

    shade\_hex = base\_hex if factor == 0 else blend\_color(base\_hex, factor)

    # zero-pad shade number to 3 digits

    shade\_padded = f"{shade:03d}"

    measure\_name = f"Color - {friendly} {shade\_padded}"

    upsert\_measure(measures\_list, make\_measure(measure\_name, shade\_hex))
# ------------------------------------------------------------------------------------------------------------
# ADD STATIC BLACK + WHITE MEASURES
# ------------------------------------------------------------------------------------------------------------
upsert_measure(measures_list, make_measure("Color - Black", "#000000"))
upsert_measure(measures_list, make_measure("Color - White", "#FFFFFF"))
# ------------------------------------------------------------------------------------------------------------
# Save
# ------------------------------------------------------------------------------------------------------------
save_json(report_extensions_path, report_extensions)
print("?? Added base colors + shade variations + Black & White into 00 - Generic")
Conclusion
If you spend even 30 minutes per month tweaking color codes, color measures will quickly pay for themselves.
Adopt a semantic + shade naming pattern (Color - Role, 000 to 500)
Apply measures to color properties via Field value
Use the C# + Tabular Editor or PBIP + Python script to generate everything automatically
Extra tip: MCPs can also help you tackle this scenario.

There are many ways to handle colors in Power BI, but building a reusable color system is one of the most useful improvements you can make. Color measures that are generated automatically and named consistently make your reports easier to maintain and far more resilient to unexpected branding changes.
If you'd like to take this approach further, or if your organization wants a more scalable and futureproof Power BI environment, feel free to reach out to me or my colleagues. Our team can help you design a robust color system, speed up your development workflow, or support broader data and reporting needs.
Want to implement this in your workflow, too?

Femke Coenye
Femke is a certified Power BI Data Analyst with a background in front-end development and UI/UX design. She brings a visual eye to reporting that most data consultants don't have, which means her dashboards don't just work, they look like someone actually thought about the person reading them.