
Automating Data Pipelines with Microsoft Fabric for Faster Insights
A report is only as fresh as the last time someone remembered to refresh it. Maybe you manage semantic models with dozens of queries and struggle to keep the transformation steps under control. Maybe your reports need data the moment it is captured. Either way, doing it by hand does not scale.
Microsoft Fabric has an answer: Data Pipelines. In this article we look at how to automate your ETL processes with them, so data management gets simpler and your data shows up when your reports need it.
What are data pipelines in Fabric
Data Pipelines are the components in Microsoft Fabric that automate moving, transforming, and loading data from a wide variety of sources into your destinations of choice. You define the workflow once, the pipeline runs it, and you spend your time on analysis instead of on plumbing. And because the process is automated, insights arrive faster too.
Wondering if this will be too technical for you? It won't. Data Pipelines are made for teams that want to automate and scale standard ETL processes in a low/no-code environment.
Key Components and Steps
Here are the steps that take you from data source to data that's ready for your reports.
Data Ingestion
First, you need to get the data and store it somewhere. This is the first choice you make when you land on the start page of your Data Pipeline.
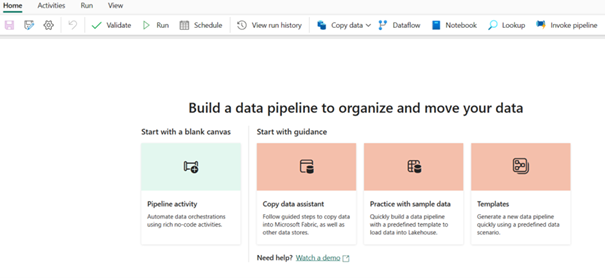
There are a few options here. You can start with a blank canvas and pick activities yourself, or go for a bit more guidance with one of the following: the Copy data assistant, practicing with sample data, or starting from a template.
Copy data assistant
A wizard guides you through choosing a data source and a supported destination for the data.
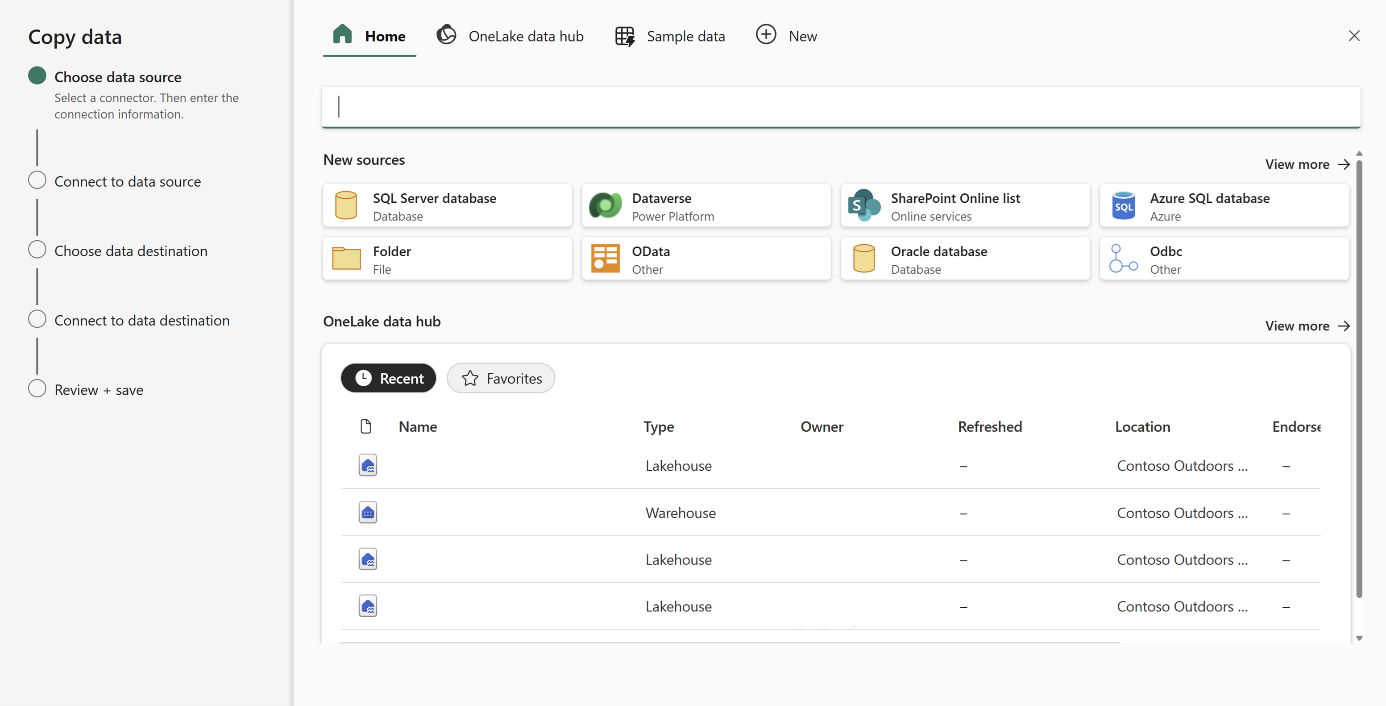
Practice with sample data
This option sets up the ingestion of the Contoso sample data into a lakehouse destination of your choosing.
Templates
A rich collection of templates to help you build the solution you need.
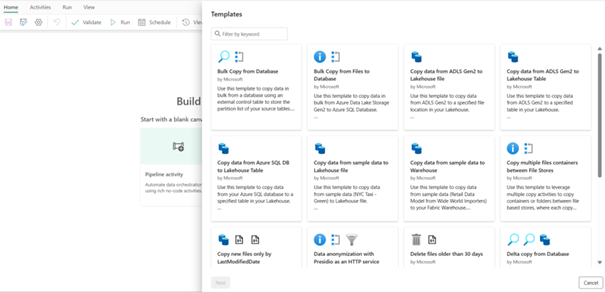
Pipeline activities
Prefer to build it yourself? You can also select a Pipeline activity of your own choice. There is a library of different activities available, including the Copy activity and the Dataflows Gen2 activity for data ingestion.
Data Transformation
Once ingestion is done, your data is in the pipeline. Unfortunately, data hardly ever arrives in the shape your reports need.
If you use the Dataflows activity, you can do your transformations right there, using the Power Query interface. For Power BI developers this is familiar ground: Power Query is usually already part of their toolbox. The low-code experience also makes transformations accessible to more of the team.
The Copy data activity is faster than Dataflows, but it is built to move data from one place to another without changing it. If you need transformations, you'll add other activities for those steps.
Data Storage
Depending on your data source, there are various possible destinations (sinks) to store your data. Some examples:
Azure Data Lake Storage (ADLS): ideal for storing large amounts of unstructured data.
Azure SQL Database: suitable for relational data storage and supports SQL-based querying.
Azure Synapse Analytics: an analytics service that combines big data and data warehousing.
Azure Blob Storage: useful for storing binary and text data.
Azure Cosmos DB: a globally distributed, multi-model database service.
Azure Data Explorer: optimized for fast, ad-hoc data exploration and analytics.
Power BI: load data directly into Power BI datasets for reporting and visualization.
Azure Table Storage: a NoSQL store for schemaless storage of structured data.
An interesting detail: you can use Data Pipelines to refresh your semantic models. Use an activity to store the data into the source your semantic model uses, then run the semantic model refresh activity to load the new data into your model. You can go for a full model refresh, or a partial one that targets only the tables or partitions that need refreshing.
Data Orchestration
Pipelines automate data refreshes, and they can also send notifications to alert us of failures or successes. Two scenarios where orchestration pays off:
Predictive maintenance for equipment: IoT sensors in factories or vehicles collect data on machine performance. Automated pipelines process this data to predict failures early, reducing downtime.
Dynamic pricing models: airlines, e-commerce platforms, and ride-sharing services use automated pipelines to analyze demand fluctuations and adjust prices in real time based on market conditions.
Because you orchestrate what happens the moment new data streams in, pipelines make it easier to work with real-time or near-real-time data, without relying on DirectQuery in your semantic models.
You also choose how a pipeline runs: manually, on a schedule, or event-driven. Event-driven triggers are useful when data arrives on an irregular basis and needs to be in your report as soon as possible.
Fabric's Data Pipelines are a powerful tool for getting faster insights in Power BI. Dataflows Gen2 as an activity gives users who know Power BI a familiar, recognizable experience, and gives less technical users a way to shape data with low-code transformations instead of code-based notebooks. The orchestration side makes near-real-time reporting possible without DirectQuery, by refreshing only the affected partitions or tables through the semantic model refresh activity. Whether you're building complex data solutions or just getting started, that combination keeps your data workflow simple and fast.
Ready for faster insights?
**Contact us. We're happy to show you how.
Want to implement this in your workflow, too?

Femke Coenye
Femke is a certified Power BI Data Analyst with a background in front-end development and UI/UX design. She brings a visual eye to reporting that most data consultants don't have, which means her dashboards don't just work, they look like someone actually thought about the person reading them.