Turning Power BI Into a Two-Way Street: Enabling Real-Time Scheduling with the Power Platform
Introduction
Imagine multiple people are consulting the same report on a regular basis. The report contains information about vehicles, more specifically when they are due for inspection. The report shows a list of vehicles with their respective due dates for inspection. Using that list, the people consulting the report can check which cars should be scheduled urgently, and plan accordingly. But what if I schedule an appointment for a car, and my colleague " unaware that the car has been scheduled " does the same thing a few hours or days later? Since it takes a while for the inspection system to confirm an appointment, there was always a blind time window between "not scheduled yet" and -- appointment confirmed.
So, how useful would it be if users just clicked a car within the report, confirmed it had been scheduled, with a checkmark appearing almost in real-time next to that vehicle? This way, the people opening the report later in the day will already see that this car has been taken care of.
In this blog post, we will show you how we made that work, using only a simple Power App, a 2-step Power Automate flow and a SharePoint List.
A simple layer of interactivity
Only 4 steps are needed to provide a solution to the problem.
Create a SharePoint listCreate a Power AppAdapt the reportSet up a Power Automate flow
1. Create a SharePoint List
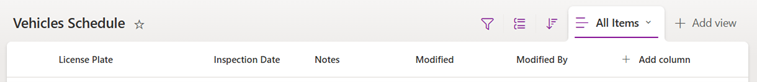
First, we need a SharePoint List containing the data we want to be able to update. Since we want to schedule cars for inspection, our list contains the vehicle's license plate, and the inspection date & hour. The license plate is used to link the SharePoint table to the other tables in the report, and the inspection date is the part we want to enable the user to update. We also added an optional field for notes.
2. Create a Power App
Since we need a simple interface to easily adapt the data in the SharePoint List, we create a Power App. After selecting the SharePoint list as the data source, Power Apps automatically generates a standard app that allows us to create, edit, and delete items from the list. This means only minimal development is required.
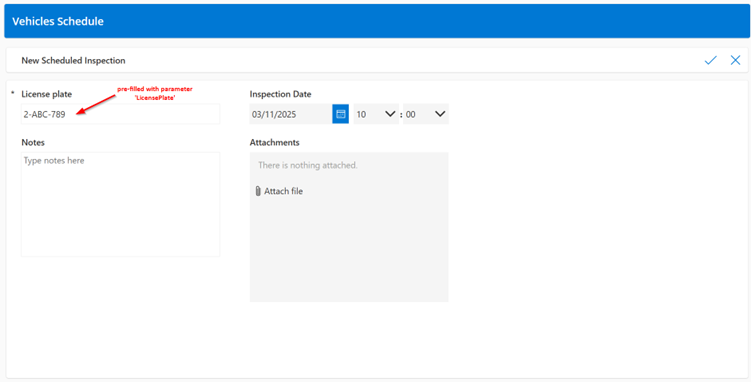
You can see below that Power Apps automatically sets up the app with all fields from our list (except Modified & Modified by, since these are updated automatically. Power Apps also adds an optional field for attachments.
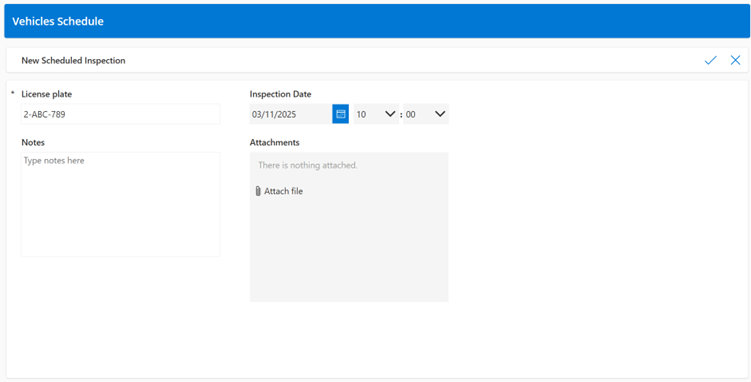
The only change we made to the app is that the license plate is now automatically filled in when scheduling a new inspection. This ensures that users can't enter incorrect license plates. To achieve this, we added an extra parameter in the Power App called LicensePlate. To set this up, we go to App ? OnStart and enter the following:

Next, within the LicensePlate field in the Power App, we simply add the following:
varLicensePlate
This way, the Power App automatically pre-fills in the parameter value of the LicensePlate in this field. We explain in the next step how this parameter value is set to the license plate of the car we want to schedule.
3. Adapt the report
In our Power BI report, we want to make it possible that when a user selects a car, a button becomes active that redirects them to the Power App to create a new inspection.
To make this work, we do the following:
In the Power BI report, we make a new measure containing the URL to the Power App. At the end of the URL, we add the Object ID parameter, to make sure the Power App pre-fills the field with the license plate of the car that the user wants to schedule.
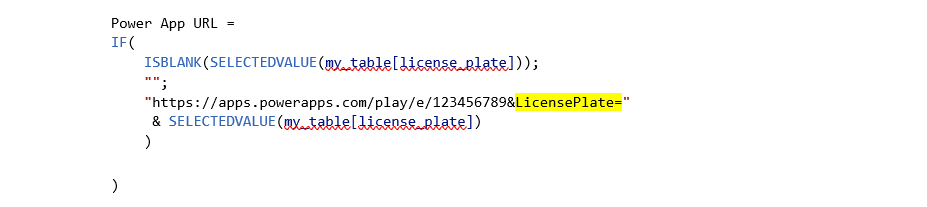
By adding the SELECTEDVALUE part, we make sure the button can only be used if a vehicle is selected by the user, indicating this through conditional formatting that changes the color of the button based on the selected license plate. The measure used for this conditional formatting looks like this:
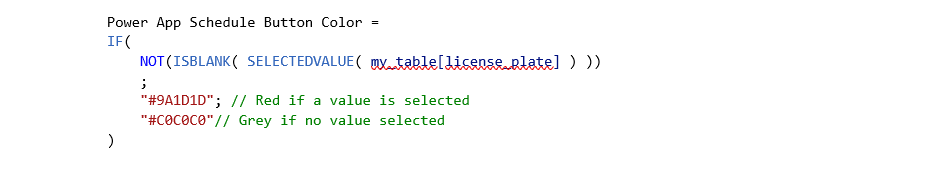
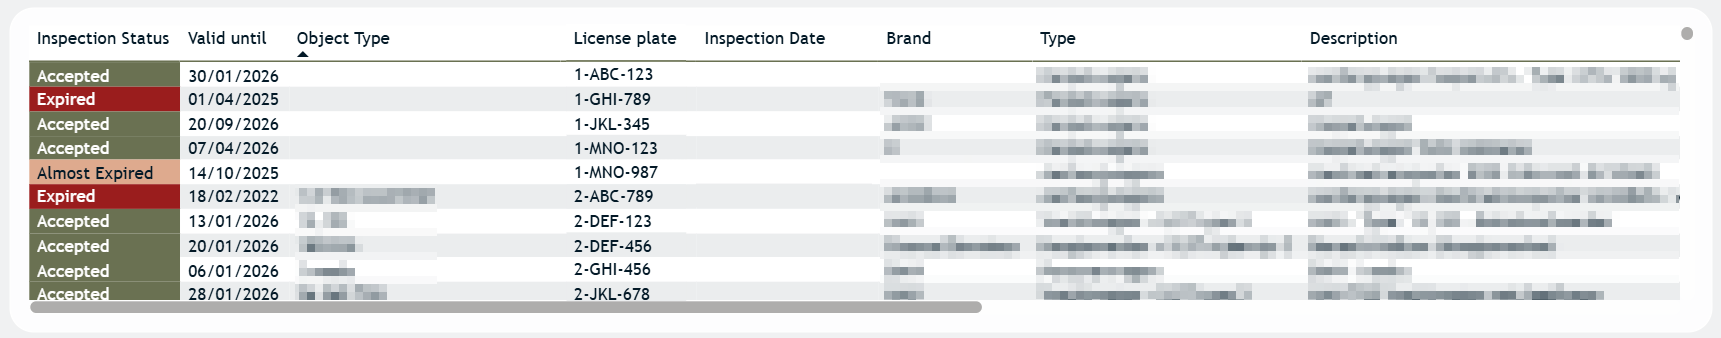
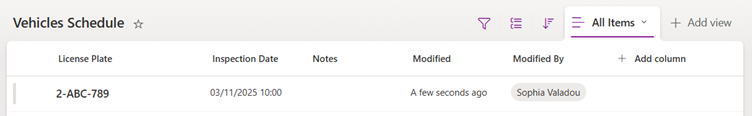
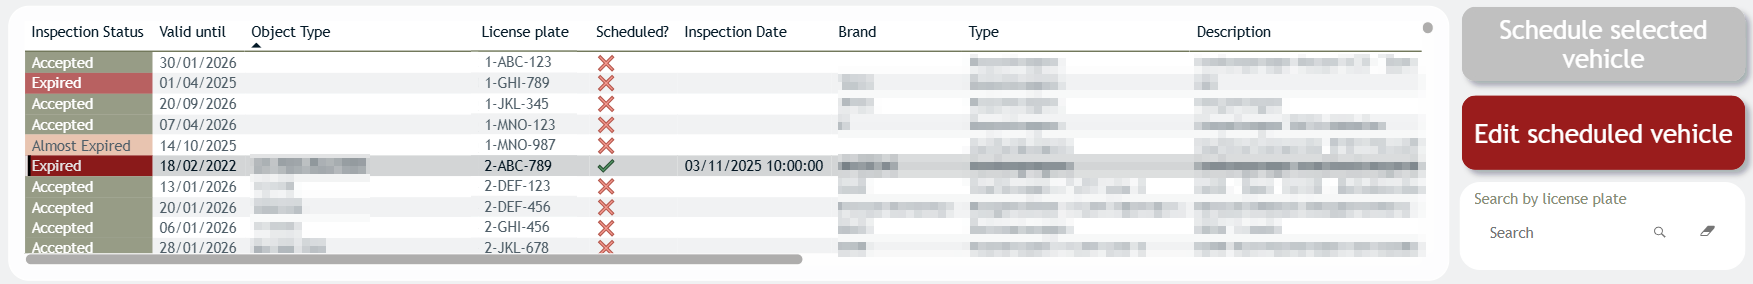
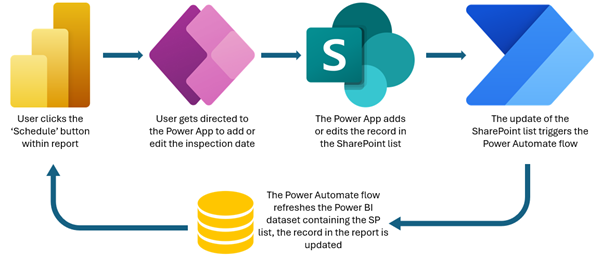
When a user wants to schedule a car, they simply select it from the table in Power BI containing all the cars. When a car has been selected, the "Schedule Selected Vehicle" button turns red, indicating that it can now be clicked. The button takes the user to the Power App, where the "License Plate" field is pre-filled with the license plate of the car they have previously selected. The user can then set a time and date for inspection in the Power App. After clicking the check button within the Power App, the vehicle is added to the SharePoint list with its inspection date.
In Power BI, the SharePoint List is added to the dataset on which the report is built. This way, we can add the inspection date to the visual. As you can see below, we added a "Scheduled" column to indicate whether the car had been scheduled using icons, and we added the inspection date next to it. This data both comes from the SharePoint list.
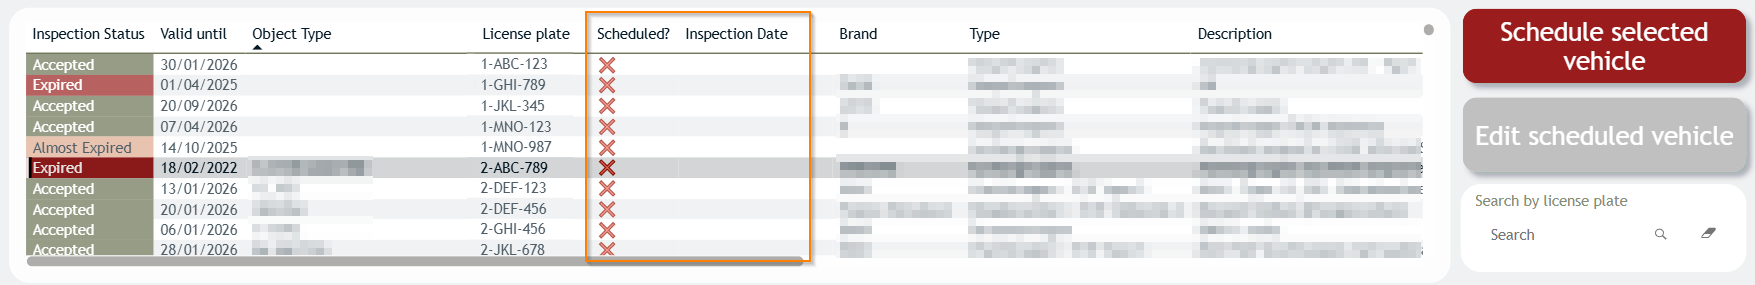
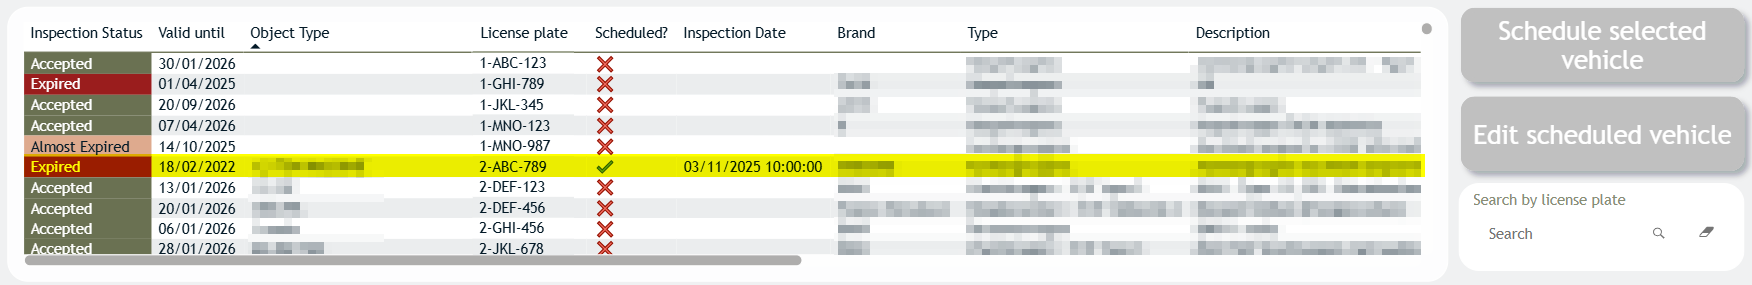
We later decided to also add a button for editing existing items of the SharePoint list. The measure containing the URL for this is similar to the other URL, but it also checks whether the selected value for the "Inspection Date" is already filled. In that case, the 'Edit Scheduled Vehicle" button lights up, and the "Schedule Selected Vehicle" button lights up when an unplanned vehicle is selected (meaning the "Inspection Date -- is blank).
4. Create a Power Automate flow
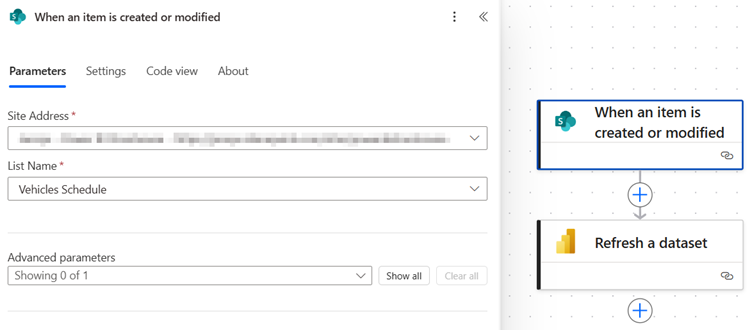
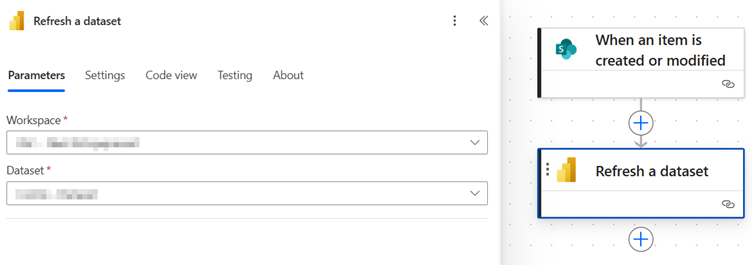
Finally, we set up a Power Automate flow that is triggered when the SharePoint list is edited. The flow then refreshes the Power BI dataset containing the SharePoint list. Only 2 blocks are needed, simple as that!
What we ended up with was a lightweight, near real-time workflow where users can schedule vehicles all from within the report.
More than just scheduling
The great thing about this approach is that it is not limited to scheduling. It's an interaction model for Power BI, where users can change the state of data on the fly, directly within the report interface.
There are other examples where this same pattern could be applied. Think of simple task claiming, where users can claim tasks by marking them as their own. It avoids duplication since it's clear to everyone who is working on what task. It could also be used for progress tracking within these tasks, by simply adapting the SharePoint list to allow for some type of progress indicator. Think of invoice follow-ups, or review queues where people take care of different files. This approach can also close the gap between the submission of a request and the approval, or even simply for adding comments within the report.
Using Power BI collaboratively
This project transformed a static, descriptive Power BI report into a collaborative tool. Instead of displaying insights, the report became part of the actual workflow, having a positive impact on team efficiency and clarity.
A big upside of the approach is that it is built completely using native Microsoft tools that work together seamlessly. This avoids the use of expensive premium licenses, the overhead of using multiple tools, custom APIs or a complex backend. Just simple building blocks, thoughtfully connected.
Final Thoughts
If you're dealing with coordination issues, duplicate work, or unclear ownership in Power BI-driven processes, consider where you could add this kind of interactivity. Whether it's scheduling, task claiming, or anything else that involves user action, Power BI can be more than just a read-only windowit can become a tool that helps your team do the work, right from the data.
Want to implement this in your workflow, too?

Sophia Valadou
Sophia studied Business Engineering at Ghent University with a specialization in Data Analytics. She builds ETL pipelines, datasets, and reports, and has hands-on experience with AI applications. Data runs in the family: both her brother and father work in the field, so she was arguably destined for this.